| Issue |
A&A
Volume 554, June 2013
|
|
|---|---|---|
| Article Number | A87 | |
| Number of page(s) | 18 | |
| Section | Interstellar and circumstellar matter | |
| DOI | https://doi.org/10.1051/0004-6361/201220795 | |
| Published online | 07 June 2013 | |
Online material
Appendix B: Spectroscopic parameters, maps, and rotational diagrams
Spectroscopic parameters of the observed transitions.
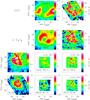 |
Fig. B.1
Integrated intensity of all the observed c-C3H2 and CCH transitions. The upper state energy level and the principal quantum numbers are shown for each transition. The smaller scale maps have been convolved to the spatial resolution of 15′′to improve the S/N. |
| Open with DEXTER | |
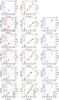 |
Fig. B.2
Rotational diagrams for CCH (top), c-C3H2 (middle), and C18O (bottom) along the Herschel strip. Data have been convolved to 40′′ for CCH and C18O, and to 29′′ for c-C3H2. Green diamonds represent the MADEX simulation towards the IF (cf. Sect. 4.2). |
| Open with DEXTER | |
© ESO, 2013
Current usage metrics show cumulative count of Article Views (full-text article views including HTML views, PDF and ePub downloads, according to the available data) and Abstracts Views on Vision4Press platform.
Data correspond to usage on the plateform after 2015. The current usage metrics is available 48-96 hours after online publication and is updated daily on week days.
Initial download of the metrics may take a while.