Free Access
Fig. B.2
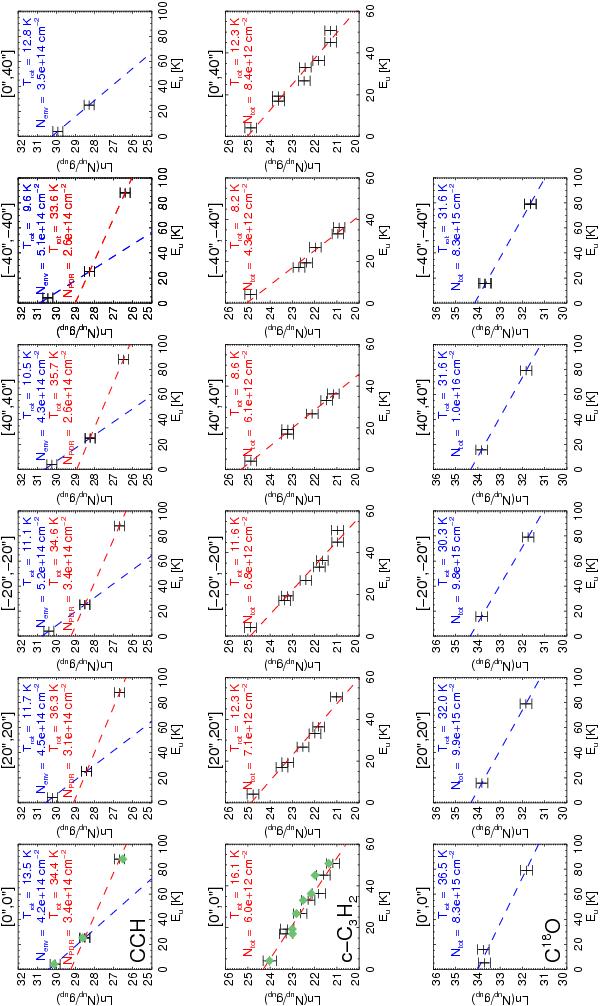
Rotational diagrams for CCH (top), c-C3H2 (middle), and C18O (bottom) along the Herschel strip. Data have been convolved to 40′′ for CCH and C18O, and to 29′′ for c-C3H2. Green diamonds represent the MADEX simulation towards the IF (cf. Sect. 4.2).
This figure is made of several images, please see below:

Current usage metrics show cumulative count of Article Views (full-text article views including HTML views, PDF and ePub downloads, according to the available data) and Abstracts Views on Vision4Press platform.
Data correspond to usage on the plateform after 2015. The current usage metrics is available 48-96 hours after online publication and is updated daily on week days.
Initial download of the metrics may take a while.