| Issue |
A&A
Volume 553, May 2013
|
|
|---|---|---|
| Article Number | L8 | |
| Number of page(s) | 6 | |
| Section | Letters | |
| DOI | https://doi.org/10.1051/0004-6361/201321431 | |
| Published online | 17 May 2013 | |
Online material
Appendix A: Numerical effects on the DGMFs
Appendix A.1: Effect of sink particles
Simulation properties (adapted from FK13).
Sink particles (Federrath et al. 2010a) in the simulations accrete material into them after their creation and affect the density structure of their immediate surroundings in the simulation (and the DGMFs). In the following, we consider the effects of sink particles to the DGMFs.
As described in FK12, the sink particles are created on a certain, resolution-dependent volume density and always have a radius of 2.5 pixels in the native resolution of the simulation. It follows that the sink particles have a resolution-dependent minimum density, which can be converted further into a minimum mean column density. Sink particles are created when a series of collapse criteria are fulfilled (see FK12), and when the local volume density exceeds  (A.1)where cs is the isothermal speed of sound and rsink the radius of the sink particle. It follows that the mean column density of a sink particle at the moment of its creation is
  (A.2)The sink particle properties are listed in Table A.1 for different physical resolutions.
The sink particle column densities listed in Table A.1 represent levels below which the DGMFs are not affected by sink particles, regardless of whether the sinks are removed or not. In the most conservative interpretation, the DGMFs are reliable only below these column density limits. Therefore, we use the upper limit of N(H2) = 11 × 1021 cm-2, which is the sink particle column density for the ℳs = 10 simulations 5123 cells in size, in the analysis performed in this paper.
However, it is not at all certain that the DGMF shape immediately above N(H2)sink is greatly affected by the sink particles. Above N(H2)sink, there are lines-of-sight whose column density is higher than the sink particle column density, but the local volume densities do not reach high enough values for sink particles to form. In fact, these lines-of-sight are more numerous in the simulations compared to those that contain sinks, especially at early times when the overall SFE is low.
We dealt with sink particles in this work by disregarding the lines-of-sight affected by them directly from the simulation data. While this procedure, in principle, eliminates the effects of sink particles, it removes mass from high column densities and can bias the DGMF downwards (steepen it). Consequently, it is important to note that the flattening of the DGMFs seen in the simulations (see Sect. 3.1) at around N(H2) ≈ 10−15 × 1021 cm-2 cannot be due to sink particle treatment, any associated incompleteness would bias the determination downwards, not upwards.
We can quantify the incompleteness due to sink particle removal by comparing DGMFs derived with and without the elimination of sink particles. This experiment is shown in Fig. A.1, which shows the ratio of the DGMFs with and without the sink particle elimination as a function of column density. The plot is shown for the model in which the effect of sinks in the examined column density range is expected to be strongest, i.e., the solenoidal simulation with 2563 cell resolution. Higher resolution increases the sink particle column density (cf. Table A.1), and more compressive forcing increases the relative amount of high column densities, thereby reducing the error in the examined column density regime. The figure shows that the error due to incompleteness (i.e., removal of high-column densities) is less than 30% below N(H2) ≲ 25 × 1021 cm-2 for SFEs up to 10%.
In summary, it can be concluded that the DGMFs derived for ℳs = 10 simulations are unaffected by the sink particles (or by their removal) below the N(H2)sink values. In addition, the error in the predicted DGMFs is less than 30% when the range up to N(H2) ≈ 25 × 1021 cm-2 is considered.
Appendix A.2: Effect of the simulation resolution
The simulations of FK12 are either 1283, 2563, 5123, or 10243 computational cells in size. In this work, we used all but those simulations that are 1283 cells in size. It is possible that the different computational resolutions used in the simulations affect the DGMFs, because especially high column densities are potentially better resolved by high-resolution simulations. We examined the possible effect of the simulation resolution to the DGMFs by comparing the DGMFs of simulations that were run with the same physical parameters, but have different computational resolution.
Figure A.2 shows as an example a comparison of DGMFs derived for models #10 and #11 that are 2563 and 5123 cells in size, respectively. All other parameters are same in these two models. The DGMF of model #10 is in good agreement with that of model #11 below the sink particle column density, N(H2) = 11 × 1021 cm-2. At higher column densities, the lower resolution simulation (#10) begins to underestimate the column densities slightly. However, it is still within 30% of the higher resolution one up to the column density of N(H2) ≈ 25 × 1021 cm-2. We conclude that the effect of resolution is less than the uncertainty due to the projection effects in the column density range N(H2) = 11 × 1021 cm-2 and accurate to 70% level up to N(H2) = 25 × 1021 cm-2.
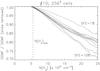 |
Fig. A.1
Error (incompleteness) in the derived DGMFs due to removal of sink particles. The figure shows the ratio of DGMFs derived with and without sink particle removal as a function of column density for time steps up to SFE = 10%. The curves for t = 0 and SFE = 0% are indistinguishable from unity. The plot is shown for simulation #10 (ℳs = 10, 2563 cells in size, b = 1/3). The error in other ℳs = 10 models is expected to be smaller, because of the higher sink particle column density and more compressive turbulence driving. |
| Open with DEXTER | |
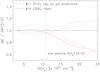 |
Fig. A.2
Effect of simulation resolution to the DGMFs. The red line shows the DGMF of simulation #10 (2563 cells in size) divided by the DGMF of simulation #11 (5123 cells in size). The physical parameters of the two simulations are the same. The dashed lines show the DGMFs calculated for different projections of model #11 divided by the mean DGMF of model #11. |
| Open with DEXTER | |
Appendix B: Illustration of column density PDFs
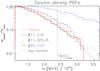 |
Fig. B.1
Column density PDFs of models #11 (b = 1/3) and #24 (b = 1), and the PDF of the Taurus molecular cloud. Both models have ℳs = 10 and B = 0 μG, and they are 5123 computational cells in size. The black histograms show the PDFs of model #11 at t = 0 (solid line) and SFE = 5% (dotted line). The blue line shows the PDF of model #24. The red line shows the PDF of Taurus from Kainulainen et al. (2009). The dynamic range of the Taurus PDF ends at about lnN(H2) = 3.2. The black dashed line shows, for reference, a lognormal function. The PDFs in the range N(H2) = 3−11 × 1021 cm-2 can be described by a lognormal function, but also reasonably well by a powerlaw function (which would be a linear curve in the given presentation). |
| Open with DEXTER | |
Figure B.1 show a comparison of the column density PDFs derived for models #11 and #24, and the PDF of the Taurus molecular cloud from Kainulainen et al. (2009). The higher relative amount of high-column density material predicted by fully compressive simulations (#24) causes a flatter PDF. In the column density range N(H2) = 3−25 × 1021 cm-2, the PDF of simulation #11 is close to what is observed in Taurus. In this narrow range, the PDF is in reasonable agreement with either a lognormal function (shown for a reference in the figure) or a powerlaw function.
© ESO, 2013
Current usage metrics show cumulative count of Article Views (full-text article views including HTML views, PDF and ePub downloads, according to the available data) and Abstracts Views on Vision4Press platform.
Data correspond to usage on the plateform after 2015. The current usage metrics is available 48-96 hours after online publication and is updated daily on week days.
Initial download of the metrics may take a while.