| Issue |
A&A
Volume 548, December 2012
|
|
|---|---|---|
| Article Number | A45 | |
| Number of page(s) | 19 | |
| Section | Extragalactic astronomy | |
| DOI | https://doi.org/10.1051/0004-6361/201220059 | |
| Published online | 19 November 2012 | |
Online material
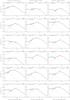 |
Fig. 11
Mid-IR SEDs for the sSHzRG sample. Black points: photometric data. Green points: measurements used to normalise the contribution from an old stellar population. Red points: results after subtraction of the stellar contribution. Dashed green line: model stellar emission. Dashed red line: best-fitting torus model. Full black line: sum of stellar and torus models. |
| Open with DEXTER | |
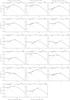 |
Fig. 11
continued. |
| Open with DEXTER | |
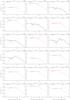 |
Fig. 12
Mid-IR SEDs for the s3CR sample. The symbols are the same than in Fig. 11. |
| Open with DEXTER | |
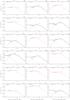 |
Fig. 12
continued. |
| Open with DEXTER | |
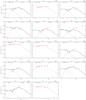 |
Fig. 12
continued. |
| Open with DEXTER | |
Radio data for the SHzRG sample from the literature and core dominance calculated.
3CR sample, Spitzer observations.
© ESO, 2012
Current usage metrics show cumulative count of Article Views (full-text article views including HTML views, PDF and ePub downloads, according to the available data) and Abstracts Views on Vision4Press platform.
Data correspond to usage on the plateform after 2015. The current usage metrics is available 48-96 hours after online publication and is updated daily on week days.
Initial download of the metrics may take a while.