| Issue |
A&A
Volume 547, November 2012
|
|
|---|---|---|
| Article Number | A107 | |
| Number of page(s) | 16 | |
| Section | Galactic structure, stellar clusters and populations | |
| DOI | https://doi.org/10.1051/0004-6361/201219695 | |
| Published online | 06 November 2012 | |
Online material
Appendix A: Plots of the entire sample
All plots used in the analysis of structural and fundamental parameters are displayed in this Appendix. Figure A.1 shows the stellar surface-density maps and the distribution of the stellar density as a function of radius (same as Fig. 1).
Figure A.2 presents colour–colour and colour–magnitude diagrams in the left-hand panel (same as Fig. 2). The centre and right panels show the histogram of age and the mass distribution, respectively (same as Fig. 3).
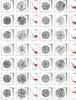 |
Fig. A.1
Left: stellar surface-density map (σ (stars/arcmin2)) obtained for the region of 30 arcmin around the clusters. The comparison field-stars area is indicated by dashed lines, while the full line indicates the cluster area. Centre: a zoom of the σ map indicating by crosses the position of objects with membership probability P > 70%. Right: the distribution of the stellar density as a function of radius. The best fitting of observed radial density profile, indicated by the full line, was obtained by using the model from King (1962). A dashed line indicates the background density (σbg). |
| Open with DEXTER | |
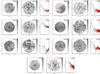 |
Fig. A.1
continued. |
| Open with DEXTER | |
 |
Fig. A.2
Left panels: colour–colour and colour–magnitude diagrams. The MS and the ZAMS are indicated by full lines, while the locus of giant stars is represented by a dotted line. Reddening vectors from Rieke & Lebofsky (1985) are shown by dot-dashed lines. The isochrones and evolutionary pre-MS tracks from Siess et al. (2000). Cluster members are indicated by open diamonds (P50) and dots (P?). Centre: age distribution of clusters members (thick line) showing the contribution of P50 (dotted line) and P? (dashed line) objects. Right: observed mass distribution indicated by crosses with error bars. The thick line represents the mass function φ(m) fitting. |
| Open with DEXTER | |
 |
Fig. A.2
continued. |
| Open with DEXTER | |
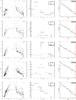 |
Fig. A.2
continued. |
| Open with DEXTER | |
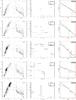 |
Fig. A.2
continued. |
| Open with DEXTER | |
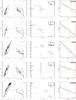 |
Fig. A.2
continued. |
| Open with DEXTER | |
© ESO, 2012
Current usage metrics show cumulative count of Article Views (full-text article views including HTML views, PDF and ePub downloads, according to the available data) and Abstracts Views on Vision4Press platform.
Data correspond to usage on the plateform after 2015. The current usage metrics is available 48-96 hours after online publication and is updated daily on week days.
Initial download of the metrics may take a while.