Fig. A.1
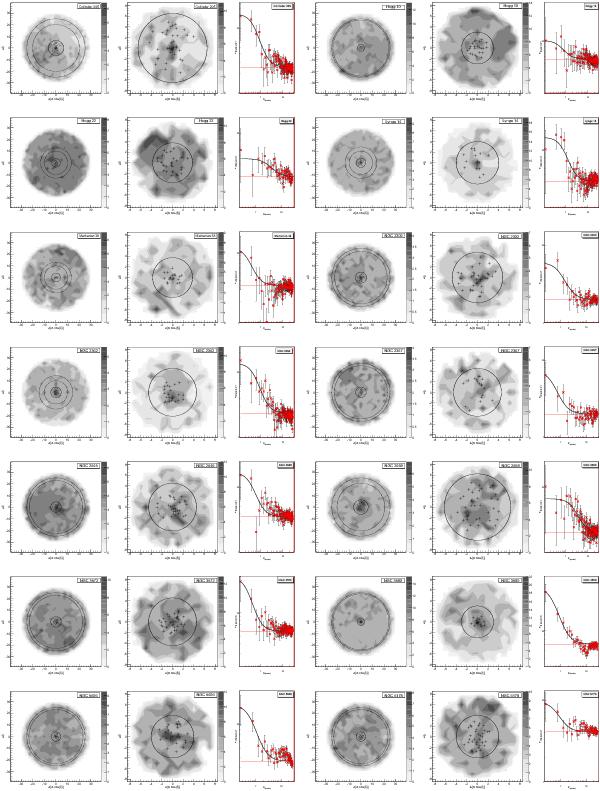
Left: stellar surface-density map (σ (stars/arcmin2)) obtained for the region of 30 arcmin around the clusters. The comparison field-stars area is indicated by dashed lines, while the full line indicates the cluster area. Centre: a zoom of the σ map indicating by crosses the position of objects with membership probability P > 70%. Right: the distribution of the stellar density as a function of radius. The best fitting of observed radial density profile, indicated by the full line, was obtained by using the model from King (1962). A dashed line indicates the background density (σbg).
Current usage metrics show cumulative count of Article Views (full-text article views including HTML views, PDF and ePub downloads, according to the available data) and Abstracts Views on Vision4Press platform.
Data correspond to usage on the plateform after 2015. The current usage metrics is available 48-96 hours after online publication and is updated daily on week days.
Initial download of the metrics may take a while.