| Issue |
A&A
Volume 547, November 2012
|
|
|---|---|---|
| Article Number | A39 | |
| Number of page(s) | 27 | |
| Section | Extragalactic astronomy | |
| DOI | https://doi.org/10.1051/0004-6361/201219668 | |
| Published online | 24 October 2012 | |
Online material
Appendix A: CO and Hi observed and model spectra of the Taffy system UGC 12914/15
For a better readability of this article, we decided to show the CO and Hi observed and model spectra as an appendix.
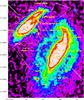 |
Fig. A.1
CO(1−0) spectra (yellow line and yellow scale, intensity in milliKelvins) overlaid with Hi spectra (black line) on a Digitized Sky survey image of the UGC 12914/5 system (from Braine et al. 2003). The center of UGC 12915 is at 00h01m41.9s, 23°29′44.9′′. The bridge region is delimited by the white polygon. |
| Open with DEXTER | |
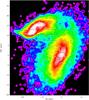 |
Fig. A.2
Simulation 20. CO(1−0) model spectra (white line) overlaid with Hi spectra (black line) on the model stellar surface density distribution. |
| Open with DEXTER | |
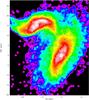 |
Fig. A.3
Simulation 19. CO(1−0) model spectra (white line) overlaid with Hi spectra (black line) on the model stellar surface density distribution. |
| Open with DEXTER | |
 |
Fig. A.4
Simulation 19 where the disk gas has been removed. Thus only the gas located in the bridge region is visible. CO(1−0) model spectra (white line) overlaid with Hi spectra (black line) on the model stellar surface density distribution. |
| Open with DEXTER | |
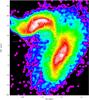 |
Fig. A.5
Simulation 19 wihout cloud-cloud collisions. CO(1−0) model spectra (white line) overlaid with Hi spectra (black line) on the model stellar surface density distribution. |
| Open with DEXTER | |
© ESO, 2012
Current usage metrics show cumulative count of Article Views (full-text article views including HTML views, PDF and ePub downloads, according to the available data) and Abstracts Views on Vision4Press platform.
Data correspond to usage on the plateform after 2015. The current usage metrics is available 48-96 hours after online publication and is updated daily on week days.
Initial download of the metrics may take a while.