Free Access
Fig. A.1
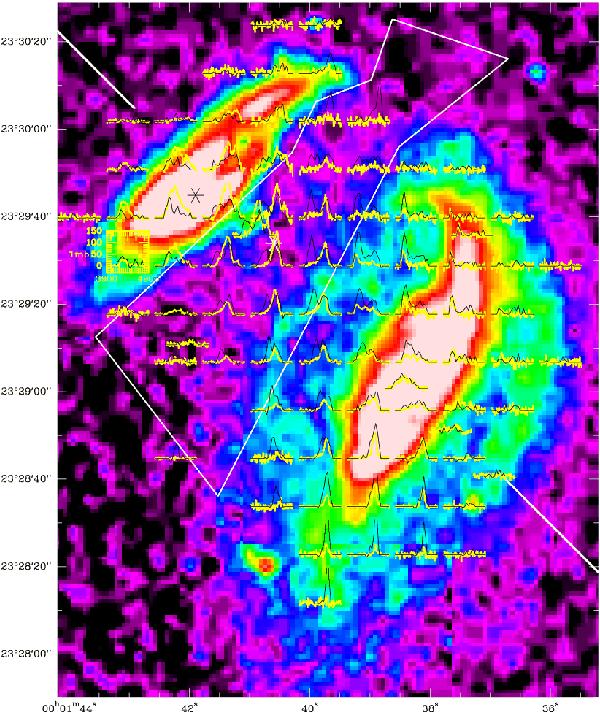
CO(1−0) spectra (yellow line and yellow scale, intensity in milliKelvins) overlaid with Hi spectra (black line) on a Digitized Sky survey image of the UGC 12914/5 system (from Braine et al. 2003). The center of UGC 12915 is at 00h01m41.9s, 23°29′44.9′′. The bridge region is delimited by the white polygon.
Current usage metrics show cumulative count of Article Views (full-text article views including HTML views, PDF and ePub downloads, according to the available data) and Abstracts Views on Vision4Press platform.
Data correspond to usage on the plateform after 2015. The current usage metrics is available 48-96 hours after online publication and is updated daily on week days.
Initial download of the metrics may take a while.