| Issue |
A&A
Volume 547, November 2012
|
|
|---|---|---|
| Article Number | A11 | |
| Number of page(s) | 23 | |
| Section | Interstellar and circumstellar matter | |
| DOI | https://doi.org/10.1051/0004-6361/201219139 | |
| Published online | 22 October 2012 | |
Online material
Appendix A: Conversion between dust opacity and extinction
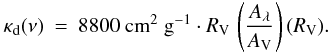
In Eq. (3), we have provided a
conversion between the frequency dependent dust opacity
κd(ν) and the NIR extinction law (Cardelli et al. 1989) in order to be able to compare
the behaviour of the scatter-free dust opacities of Ossenkopf & Henning (1994) and the extinction law at NIR wavelengths in
Fig. 4. Below, we derive this equation in detail
by starting from the relation between the extinction value and the optical depth at a
given wavelength:  Here, ρ is the density of
the material that causes the extinction Aλ
with its opacity κλ along the LoS path
x. This can be written in terms of a surface density Σg,d
that includes both dust and gas. Their properties are being disentangled as follows,
where Xg,d is the gas-to-dust ratio, which is assumed to be
150 in this paper (Sodroski et al. 1997):
Here, ρ is the density of
the material that causes the extinction Aλ
with its opacity κλ along the LoS path
x. This can be written in terms of a surface density Σg,d
that includes both dust and gas. Their properties are being disentangled as follows,
where Xg,d is the gas-to-dust ratio, which is assumed to be
150 in this paper (Sodroski et al. 1997):
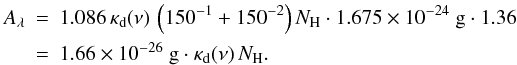
 At this point, we have come to a relation
between the extinction Aλ and the dust
opacity κd(ν) that depends on the column
density of hydrogen atoms NH. The conversion between the
hydrogen and the mean gas mass is
mg/mH = 1.36. When replacing
the constants with the corresponding numbers, we get
At this point, we have come to a relation
between the extinction Aλ and the dust
opacity κd(ν) that depends on the column
density of hydrogen atoms NH. The conversion between the
hydrogen and the mean gas mass is
mg/mH = 1.36. When replacing
the constants with the corresponding numbers, we get
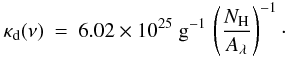
 Expressed as a relation for
κd(ν), we find
Expressed as a relation for
κd(ν), we find
 In the NIR, the extinction law is
insensitive to variations in
RV = AV/EB − V.
Therefore, we can use Cardelli et al. (1989) to
transform the ratios
NH/AJ
(Vuong et al. 2003) and
NH/EJ − K
(Martin et al. 2012) to hydrogen column density
vs. NIR extinction ratios. If the
NH/AV or
NH/EB − V
ratios are used instead, they implicitly introduce a dependence of
RV as follows:
In the NIR, the extinction law is
insensitive to variations in
RV = AV/EB − V.
Therefore, we can use Cardelli et al. (1989) to
transform the ratios
NH/AJ
(Vuong et al. 2003) and
NH/EJ − K
(Martin et al. 2012) to hydrogen column density
vs. NIR extinction ratios. If the
NH/AV or
NH/EB − V
ratios are used instead, they implicitly introduce a dependence of
RV as follows: 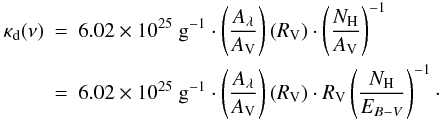 \newpageThe ratio
Aλ/AV as a
function of RV represents the extinction law of Cardelli et al. (1989). Several values for the ratio
between the hydrogen column density and the colour excess
EB − V can be applied.
If, for instance, the ratio of Bohlin et al.
(1978) is used, we get
\newpageThe ratio
Aλ/AV as a
function of RV represents the extinction law of Cardelli et al. (1989). Several values for the ratio
between the hydrogen column density and the colour excess
EB − V can be applied.
If, for instance, the ratio of Bohlin et al.
(1978) is used, we get 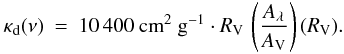 For a more recent characterisation of that
ratio (Ryter 1996; Güver & Özel 2009; Watson
2011), the numerical value in this conversion is modified by about 18%. To be
able to convert the quoted ratio
NH/AV to
NH/EB − V,
we have assumed RV = 3.1 as the mean value for the diffuse
ISM, and replaced the corresponding ratio in the equation above:
For a more recent characterisation of that
ratio (Ryter 1996; Güver & Özel 2009; Watson
2011), the numerical value in this conversion is modified by about 18%. To be
able to convert the quoted ratio
NH/AV to
NH/EB − V,
we have assumed RV = 3.1 as the mean value for the diffuse
ISM, and replaced the corresponding ratio in the equation above:
Appendix B: Spitzer IRS spectra
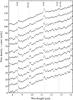 |
Fig. B.1
Mid-infrared spectra at 11 positions across B68 obtained with the Spitzer IRS instrument. The most prominent spectral features are indicated by dashed lines. The flux density is given in mJy. The individual spectra are offset by 10 mJy each. There is no significant variation in the strength of the PAH features. |
| Open with DEXTER | |
Coordinates of the Spitzer IRS observations used to extract the background spectra.
Appendix C: CO spectra
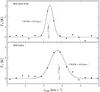 |
Fig. C.1
13CO (2–1) spectra extracted at two positions in the
corresponding map. The upper spectrum shows a line on the western rim of B68
(RA (J2000) = |
| Open with DEXTER | |

Appendix D: Radial NIR extinction profiles
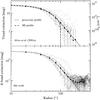 |
Fig. D.1
Radial profiles extracted from the extinction map of Alves et al. (2001a) (upper panel) and the newly calculated extinction map shown in Fig. 2 (lower panel). The small dots represent the data in the maps after regridding them to the same scale; the large dots are the mean values in bins of 20″ each with the error bars indicating the corresponding rms scatter. The mean distributions follow a profile fit similar to Eq. (15) (solid line). The power-law indices are α = 3.3 in the upper panel and α = 3.1 in the lower panel. For comparison, we added the profile of the BES (dashed line) given by Alves et al. (2001b). |
| Open with DEXTER | |
© ESO, 2012
Current usage metrics show cumulative count of Article Views (full-text article views including HTML views, PDF and ePub downloads, according to the available data) and Abstracts Views on Vision4Press platform.
Data correspond to usage on the plateform after 2015. The current usage metrics is available 48-96 hours after online publication and is updated daily on week days.
Initial download of the metrics may take a while.