Fig. D.1
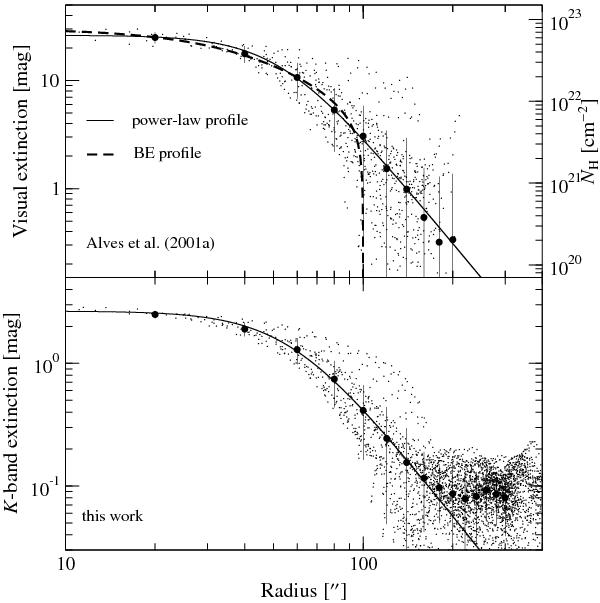
Radial profiles extracted from the extinction map of Alves et al. (2001a) (upper panel) and the newly calculated extinction map shown in Fig. 2 (lower panel). The small dots represent the data in the maps after regridding them to the same scale; the large dots are the mean values in bins of 20″ each with the error bars indicating the corresponding rms scatter. The mean distributions follow a profile fit similar to Eq. (15) (solid line). The power-law indices are α = 3.3 in the upper panel and α = 3.1 in the lower panel. For comparison, we added the profile of the BES (dashed line) given by Alves et al. (2001b).
Current usage metrics show cumulative count of Article Views (full-text article views including HTML views, PDF and ePub downloads, according to the available data) and Abstracts Views on Vision4Press platform.
Data correspond to usage on the plateform after 2015. The current usage metrics is available 48-96 hours after online publication and is updated daily on week days.
Initial download of the metrics may take a while.