| Issue |
A&A
Volume 546, October 2012
|
|
|---|---|---|
| Article Number | L8 | |
| Number of page(s) | 5 | |
| Section | Letters | |
| DOI | https://doi.org/10.1051/0004-6361/201219745 | |
| Published online | 16 October 2012 | |
Online material
Appendix A: HD 172555 photometry compilation
Table A.1 shows a compilation of current literature and Herschel photometry for HD 172555.
Available photometry.
Appendix B: How to derive the oxygen mass
In the following we explain how to derive the atomic oxygen gas mass from prompt
emission level population. To estimate the mass of oxygen gas we consider the excitation
of atomic oxygen to its first fine structure level in the absence of a collisional
partner. This situation happens in very low density environments such as debris discs.
The main mechanism involved is the so-called prompt emission and fluorescence. The
prompt emission involves the absorption of a photon from the star or from the dust at
the precise wavelength of the atomic emission, and subsequent re-emission. To model the
emission, we assume that the ground state is the most populated. The population at
steady-state for level  is given
by:
is given
by:  (B.1)Assuming that only the
first two levels are populated
(n = n0 + n1),
(B.1)Assuming that only the
first two levels are populated
(n = n0 + n1),
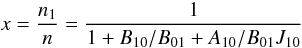 (B.2)since
g0B01 = g1B10
and
B10 = (c2/2hν3)A10,
the fractional population is
(B.2)since
g0B01 = g1B10
and
B10 = (c2/2hν3)A10,
the fractional population is 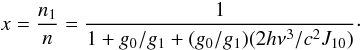 (B.3)For OI we have
g0 = 5, g1 = 3.
J10 is computed using the distance-dilluted stellar flux
in the Rayleigh-Jeans regime at 63 μm:
(B.3)For OI we have
g0 = 5, g1 = 3.
J10 is computed using the distance-dilluted stellar flux
in the Rayleigh-Jeans regime at 63 μm:
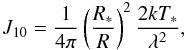 (B.4)where
R is the distance to the star and R∗
the stellar radius. We obtain
J10 = 2.273 × 10-13 × (1 AU/
R(AU))2 erg s-1 cm-2 Hz-1 sr-1,
and the fractional population is thus: x = 8.67 × 10⁻⁵
(B.4)where
R is the distance to the star and R∗
the stellar radius. We obtain
J10 = 2.273 × 10-13 × (1 AU/
R(AU))2 erg s-1 cm-2 Hz-1 sr-1,
and the fractional population is thus: x = 8.67 × 10⁻⁵
The number of oxygen atoms given the flux in cgs is then
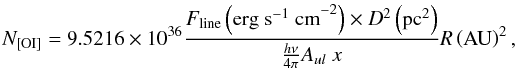 (B.5)where
9.5216 × 1036 combines the conversion from arcsec2 to steradian
and from AU to parsec.
(B.5)where
9.5216 × 1036 combines the conversion from arcsec2 to steradian
and from AU to parsec.
The effect of including additional excitation paths is negligible. We compare this with
a situation when the emission is produced at 1 AU from the star. For example, if we
include all main fluorescence pumping paths ( →
→
 →
→
 ,
,
 →
→
 →
, and
→
→
, and
→
 →
→
), the final
mass of oxygen is
M([OI] ) = 0.0247 M⊕, compared to
M([OI] ) = 0.025 M⊕ obtained when
we only include the main excitation path.
→
→
), the final
mass of oxygen is
M([OI] ) = 0.0247 M⊕, compared to
M([OI] ) = 0.025 M⊕ obtained when
we only include the main excitation path.
© ESO, 2012
Current usage metrics show cumulative count of Article Views (full-text article views including HTML views, PDF and ePub downloads, according to the available data) and Abstracts Views on Vision4Press platform.
Data correspond to usage on the plateform after 2015. The current usage metrics is available 48-96 hours after online publication and is updated daily on week days.
Initial download of the metrics may take a while.