| Issue |
A&A
Volume 546, October 2012
|
|
|---|---|---|
| Article Number | L8 | |
| Number of page(s) | 5 | |
| Section | Letters | |
| DOI | https://doi.org/10.1051/0004-6361/201219745 | |
| Published online | 16 October 2012 | |
HD 172555: detection of 63 μm [OI] emission in a debris disc⋆,⋆⋆
1
Centro de Astrobiología – Depto. Astrofísica (CSIC–INTA), ESAC Campus, PO
Box 78,
28691
Villanueva de la Cañada,
Spain
e-mail: This email address is being protected from spambots. You need JavaScript enabled to view it.
2
Calar Alto Observatory, Centro Astronómico Hispano-Alemán C/Jesús Durbán Remón,
2-2, 04004
Almería,
Spain
3
UJF-Grenoble 1/CNRS-INSU, Institut de Planétologie et
d’Astrophysique (IPAG) UMR 5274, 38041
Grenoble,
France
4
Exoplanets and Stellar Astrophysics Lab, NASA Goddard Space Flight
Center, Code 667, Greenbelt, MD,
20771,
USA
5
Dep. de Física Teórica, Fac. de Ciencias, UAM Campus Cantoblanco,
28049
Madrid,
Spain
6
SOFIA-USRA, NASA Ames Research Center, MS N211-3,
Moffett Field,
CA
94035,
USA
7
Astronomy Department, University of California,
Berkeley
CA
94720-3411,
USA
8
ALMA, Avda Apoquindo 3846, Piso 19, Edificio Alsacia, Las Condes,
Santiago,
Chile
9
Laboratorio Franco-Chileno de Astronomia (UMI 3386: CNRS – U de
Chile / PUC / U Conception), Santiago, Chile
Received: 4 June 2012
Accepted: 27 September 2012
Abstract
Context.HD 172555 is a young A7 star belonging to the β Pictoris moving group that harbours a debris disc. The Spitzer/IRS spectrum of the source showed mid-IR features such as silicates and glassy silica species, indicating the presence of a warm dust component with small grains, which places HD 172555 among the small group of debris discs with such properties. The IRS spectrum also shows a possible emission of SiO gas.
Aims. We aim to study the dust distribution in the circumstellar disc of HD 172555 and to asses the presence of gas in the debris disc.
Methods. As part of the GASPS open time key programme, we obtained Herschel/PACS photometric and spectroscopic observations of the source. We analysed PACS observations of HD 172555 and modelled the spectral energy distribution with a modified blackbody and the gas emission with a two-level population model with no collisional de-excitation.
Results. We report for the first time the detection of [OI] atomic gas emission at 63.18 μm in the HD 172555 circumstellar disc. We detect excesses due to circumstellar dust toward HD 172555 in the three photometric bands of PACS (70, 100, and 160 μm). We derive a large dust particle mass of (4.8 ± 0.6) × 10-4 M⊕ and an atomic oxygen mass of 2.5 × 10⁻²R2 M⊕, where R in AU is the separation between the star and the inner disc. Thus, most of the detected mass of the disc is in the gaseous phase.
Key words: line: formation / Kuiper belt: general / stars: pre-main sequence / circumstellar matter / stars: individual: HD 172555
Herschel is an ESA space observatory with science instruments provided by European-led Principal Investigator consortia and with important participation from NASA.
Appendices A and B are available in electronic form at http://www.aanda.org
© ESO, 2012
1. Introduction
Circumstellar discs play a key role in understanding how planets form and evolve, since it is thought that they originate in gas-rich circumstellar discs around young stars, the so-called protoplanetary discs. Around older stars, with ages greater than about 5 to 10 Myr, another type of disc is seen: dusty, optically thin debris discs that are produced by destructive collisions between planetesimals formed in the protoplanetary disc phase. The younger debris discs (~5−100 Myr) are the likely sites of ongoing terrestrial planet formation, while the older ones (0.1–1 Gyr) correspond to the “clearing out” phase, when most planetesimals left over from planet formation are removed from the system.
While debris dust has been extensively observed, previous studies have provided little unambiguous information on the chemical composition of the dust. Most debris discs have featureless IR spectra, since the grains are large and cold. However, there are a few debris discs that show strong solid-state mid-IR spectral features, indicating the presence of small, warm grains. These debris discs are probably highly transient and are produced during periods of intense collisional grinding between large bodies (Lisse et al. 2008, 2009). Gas can provide additional compositional information, but it is rarely detected in debris discs. Only two – 49 Ceti and HD 21997 – show any trace of sub-mm CO emission, indicating that typical debris gas abundances are low relative to those in younger protoplanetary discs (Dent et al. 2005; Moór et al. 2011). The only debris disc with a fairly complete inventory of its gaseous species is β Pictoris, primarily obtained through UV/optical absorption spectroscopy (Roberge et al. 2006). In general, the debris gas studied so far appears to be primarily low density and ionized, because these low-density discs are optically thin to dissociating UV photons.
HD 172555 (Gray et al. 2006) is one of these rare stars with an observed warm debris disc. This A7V-type star located at 29.2 pc (Gray et al. 2006) belongs to the β Pictoris moving group (BPMG), and as such, its age is in the range 12 Myr (Zuckerman & Song 2004) to 20 Myr (Barrado y Navascués et al. 1999). HD 172555 was originally found to harbour a bright debris disc through IRAS measurements of excess thermal emission attributed to circumstellar dust grains (Cote 1987). The Spitzer/IRS spectrum revealed strong solid-state emission features in the mid-IR, indicating that it contains a relatively large amount of warm dust in a fine μm-sized population at T ~ 300 K (Lisse et al. 2009). It has been proposed that this disc is the aftermath of a catastrophic collision between planetary mass bodies.
In this paper, we present Herschel (Pilbratt et al. 2010) far-IR photometry and spectroscopy of HD 172555, obtained as part of the “GAS in Protopolanetary Systems” (GASPS) Herschel open time key programme with the instrument PACS (Poglitsch et al. 2010). In Sect. 2 we describe the PACS spectroscopic and photometric observations. In Sect. 3 we describe the main observational and modelling results for the dust and gas discs. In Sect. 4, we discuss possible origins for the detected OI gas.
2. Observations and data reduction
2.1. Herschel photometry
HD 172555 falls into the field of view of our scan maps (obsids: 1342209059, 1342209060, 1342209061, 1342209062) centred on CD-64 1208, an M0-type star with which it forms a wide binary system on a ~2000 AU orbit (Feigelson et al. 2006). Photometry was acquired with standard minimap configuration, with a scan length of 3′ and scan angles 70° and 110° for the 70 and 100 μm bands. The Herschel/PACS photometer observes simultaneously in 70/100 μm and 160 μm, so this gave us four maps at 160 μm. Photometric observations were reduced using HIPE 8. We combined the final images at the same wavelength using IRAF (http://iraf.noao.edu/) IMCOMBINE, weighting the images with the exposure time. We performed aperture photometry with an aperture radius of 6″ for the 70 and 100 μm bands and 12″ for the 160 μm band. Photometric errors were computed by averaging the standard deviation in nine positions surrounding the source scaled with the square root of the number of pixels inside the aperture. Finally, we applied the aperture corrections supplied by the PACS team. Photometric fluxes are listed in Table 1. The source is point-like in the three PACS bands. The PACS photometric points are shown in blue in Fig. 1.
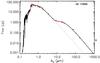 |
Fig. 1 HD 172555 SED. The dashed line represents the photospheric contribution fitted using VOSA (Bayo et al. 2008) with Teff = 7800 K, log g = 4.5, Lstar = 7.8 L⊙, while the solid one represents a photosphere plus modified blackbody model with T = 280 K and β = 0.2. Blue dots represent Heschel/PACS photometric points. |
2.2. Herschel spectroscopy
The star was observed in chop/nod line spectroscopic mode with PACS on March 8, 2011 and September 10, 2011. PACS allows imaging of a 47″ × 47″ field of view, resolved into 5 × 5 pixels known as spaxels. The observations were centred on the 63.18 μm [OI]  transition, within the wavelength range 62.94 to 64.44 μm, with a spectral resolution λ/Δλ of 3570. We also observed the star with PACS in pointed chopped range spectroscopic mode on September 10, 2011, with the red channel centred around 158 μm, with a spectral resolution of 1265. All spectra were reduced using HIPE 7 and a modified version of the reduction pipeline, including saturated and bad pixel removal, chop subtraction, relative spectral response correction, and flat-fielding. The spectra were extracted from the central spaxel and aperture corrected to account for dispersion in the surrounding spaxels. The final, reduced line spectra are shown in Fig. 2.
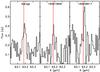 |
Fig. 2 [OI] |

3. Results
3.1. Star properties and evolutionary status
A compilation of data from the literature was made to model the spectral energy distribution (SED, see Table A.1). We also retrieved IRAC observations from the Spitzer Space Telescope archive (AOR 3923456 for 3.4, 4.5 and 5.0 μm bands and 25202432 for the 8.0 μm) and extracted aperture photometry using MOPEX. The IRAC 3.6 and 4.5 μm photometry is saturated. The stellar parameters were computed by fitting Johnson, Strömgren, and 2MASS photometry with Kurucz photospheric models making use of the Virtual Observatory SED Analyzer (VOSA, Bayo et al. 2008). We find a value of 7.8 ± 0.7 L⊙ for the stellar luminosity (while Wyatt et al. 2007, finds 9.5 L⊙) and 7800 ± 200 K for the effective temperature, while Chen et al. (2006) finds Teff = 8550 K, and Wyatt et al. (2007); Lisse et al. (2009) used Teff = 8000 K.
Figure 3 shows the position of the star in the Hertzsprung-Russell (HR) diagram. An error of ± 200 K was adopted for Teff and the error bar in the luminosity corresponds to the uncertainty of 0.2 pc. The evolutionary tracks and isochrones from the Yonsei-Yale group (Yi et al. 2001) were used. Since the metallicity of this object is almost solar ([M/H] = 0.09, Gray et al. 2006) the set with Z = 0.02 (solar) was chosen. According to this comparison, we find M ⋆ ≃ 1.68 M⊙, and log g ⋆ = 4.28, which implies R ⋆ = 1.56 R⊙. Given the position of the star and the uncertainties, we can only set a lower limit to the age of ~17 Myr (Fig. 3). The different ages quoted for BPMG members range from 12 to 50 Myr, although the latter is an upper limit.
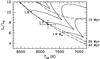 |
Fig. 3 HR diagram for HD 172555. Dashed lines depict the position of the theoretical isochrones for different ages (Yi et al. 2001) while solid lines depict evolutionary tracks for different stellar masses. |
3.2. The dust disc
As can be seen in Fig. 1, little or no excess is detected at wavelengths shorter than 7 μm, while significant excess is seen at longer wavelengths.
We used a modified blackbody model to fit the IR excess in HD 172555: Fcont = Bν × (λ0/λ)β where Bν is the Planck function, λ0 = 13 μm and β = 0 for λ < λ0. We do not use the 870 μm LABOCA point reported by Nilsson et al. (2009) because the association of the detected 2-σ signal with HD 172555 is ambiguous.
The modified blackbody model gives a temperature of 280 ± 9 K, with an opacity index (for λ > λ0) β = 0.2 ± 0.2, while a simple blackbody fit gives a higher temperature of 329 ± 6 K, but produces a poor fit to the SED. Rebull et al. (2008) fitted the HD 172555 IR excess with a blackbody at 310 K, in good agreement with our determination. We note that we can fit the whole SED with a single modified blackbody, implying that we do not see evidence from this data set for a reservoir of colder dust producing the far-IR emission. This means that the same dust population that produces the mid-IR excess can also produce the entire Herschel/PACS excess.
Using 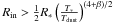 (Beckwith et al. 1990), we computed the minimum radius for the dust distribution. We get Rin, min = 4.0 ± 0.3 AU. The infrared excess computed by integrating the model is LIR/L∗ ≃ 7.3 × 10⁻⁴, slightly higher than the value shown in Wyatt et al. (2007) of 5 × 10⁻⁴. We used the flux at 160 μm to estimate the dust mass of the dust disc using Mdust = Fν(160 μm)D2/(κνBν(Tdust)), valid for optically thin discs, where Fν(160 μm) is the integrated flux density at 160 μm, D is the distance to the star (29.2 pc), Bν can be approximated with the Rayleigh-Jeans regime and κν = 2 × (1.3 mm/λ)β cm2 g-1. The final dust mass is (4.8 ± 0.6) × 10-4 M⊕.
3.3. The gas disc
The [OI] transition at 63.18 μm was detected in both observations, with a signal-to-noise ratio of ~4 in the average spectrum. The emission is only detected on the central spaxel, indicating that it is centred on the star. Line fluxes (Fline) were obtained by fitting a Gaussian plus continuum fit to the line and are shown in Table 2. In both spectral line observations, the line is spectrally unresolved within the uncertainties. The [CII]  emission line at 157.74 μm was not detected; instead, we determine a 3-σ upper limit of 2.3 × 10⁻¹⁸ W/m2 for its flux.
We computed the total [OI] mass using (see Appendix B) ![Mathematical equation: \begin{equation} \label{eqMass} {N_{\rm [OI]}} \simeq 9.5\times 10^{36} \frac{F_{\rm line}({\rm erg\ s^{-1} \ cm^{-2}})\times D^2({\rm pc^2})}{\frac{h\nu}{4\pi}A_{ul}\ x(T) }\times R^2({\rm AU}^{2}), \end{equation}](/articles/aa/full_html/2012/10/aa19745-12/aa19745-12-eq68.png) (1)where N [OI] is the number of oxygen atoms, R is the inner radius, Aul is the Einstein A coefficient, and x is the fractional population for the first excited state of the [OI] transition. If the emission originated at the minimal possible position of the dust ring at ~4.0 AU, the [OI] mass is ~0.39 M⊕. The computed mass is huge, so the reservoir for the [OI] gas must have been very large. Nevertheless, the total atomic oxygen mass strongly depends on the location where the emission comes from (as R2). For instance, the [OI] gas mass decreases to between a few 10-4 M⊕ and a few 10-3 M⊕ if it is located near the size-, and composition-dependent dust sublimation radius (~0.1–0.5 AU). But we note that, even in this case, the [OI] gas mass remains large compared to the dust mass.
(1)where N [OI] is the number of oxygen atoms, R is the inner radius, Aul is the Einstein A coefficient, and x is the fractional population for the first excited state of the [OI] transition. If the emission originated at the minimal possible position of the dust ring at ~4.0 AU, the [OI] mass is ~0.39 M⊕. The computed mass is huge, so the reservoir for the [OI] gas must have been very large. Nevertheless, the total atomic oxygen mass strongly depends on the location where the emission comes from (as R2). For instance, the [OI] gas mass decreases to between a few 10-4 M⊕ and a few 10-3 M⊕ if it is located near the size-, and composition-dependent dust sublimation radius (~0.1–0.5 AU). But we note that, even in this case, the [OI] gas mass remains large compared to the dust mass.
4. Origin of the gas
Our Herschel/PACS observations reveal a copious amount of atomic oxygen, although the exact mass depends somewhat on its unconstrained radial location (Sect. 3.3). This raises the question of its origin. HD 172555 is a rare debris disc. The dust is located in the inner system at only a few AU from the star (Sect. 3.2), in contrast to typical debris discs composed mainly of cold Kuiper belt-like dust at much larger distances from the star (e.g. the co-eval BPMG member HD 181327, Lebreton et al. 2012). Here, we speculate about two different origins for the observed [OI] gas.
4.1. Recent release during a catastrophic event
The models of Wyatt et al. (2007) argue that HD 172555 infrared fractional luminosity is ~86 times higher than the maximum value expected from steady-state collisional evolution under their modelling assumptions at an age of 12 Myr. Although a different parameter selection could perhaps explain the departure from the maximum value, the authors pointed out that a major stochastic event may be playing a role.
Emission features in the Spitzer/IRS spectrum of HD 172555 were modelled by Lisse et al. (2009), who suggested the presence of glassy silica. They also tentatively attributed faint features to rovibrational transitions of SiO gas. They concluded that the dust composition, and the presence of SiO gas (if confirmed), point to a violent production process, such as an hypervelocity collision between massive planetary bodies. This suggestion was additionally supported by the hypervelocity collision experiments conducted by Takasawa et al. (2011). These authors found that the ejecta typically had a steeper grain size distribution than expected for an equilibrium distribution in a standard collisional cascade, as proposed by Lisse et al. (2009) to describe the warm dust in HD 172555 (dn/da ~ a-4). This would argue for a source of fresh material, which would have had to be produced within the last 0.1 Myr to be consistent with SiO recondensation. Recently, Pahlevan et al. (2011) showed that silicate constituents (Si, Fe, Mg and O) can be produced in the form of gas during hypervelocity collisions. Therefore, one can speculate that the origin of atomic oxygen detected with Herschel could be the violent event proposed by Lisse et al. (2009) to explain the shape of the Spitzer/IRS spectrum.
4.2. Gas accumulation over time
The extremely low sensivity of OI to the radiation pressure from this A-type star (Fernández et al. 2006) opens the door to alternative, perhaps less catastrophic scenarios as for the origin of the detected OI gas. Atomic oxygen could indeed accumulate over time at the place where it is produced. For instance, the considerable collisional activity in the dust ring presumably releases a population of poorly bound, or unbound grains due to radiation pressure, which can collisionaly vaporize larger grains due to high relative velocities. This has been proposed by Czechowski & Mann (2007) to explain the stable gas in the co-eval β Pictoris system. Assuming that oxygen is originally locked into olivine grains, a dust mass of ~0.9 M⊕ would need to have been vaporized in less than 12 Myr, corresponding to a mass rate higher than 7 × 10⁻⁸ M⊕/yr (1013 g/s). Interestingly, this value compares to the mass rate derived by Czechowski & Mann (2007) at the peak position of the β Pictoris dust disc (50–100 AU).
The sublimation of grains close to the star, at ~0.1–0.5 AU, could also contribute to the production of OI. Although the 4 AU-radius dust ring is collision-dominated, models by Wyatt (2005) and Löhne et al. (2012) show that, even in this case, a fraction of the dust grains can escape the collisional cascade and migrate toward the star by Poynting-Robertson (P-R) drag. Silicates extracted from the ring will eventually reach sufficiently high temperatures as they approach the star and produce O, SiO and MgO, and ultimately Si, Mg and O. Assuming again that O is locked in olivine grains, a reference dust mass of ~10-3 M⊕ would need to have been extracted from the dust belt by P-R drag to explain the PACS data over an unknown time span. A strict minimum supplying mass rate of about 10-10 M⊕/yr is obtained assuming a unit efficiency in atomic O production by sublimation over the longest possible time span (12 Myr), and assuming that the gas has not viscously flown inward or outward. On the other hand, the P-R drag timescale for bound grains in the 4-AU radius dust ring, tPR > 7500 yr (e.g. Wyatt 2005), yields an upper limit on the present-day P-R drag mass loss rate of a few 10-8 M⊕/yr. This implies that this process had to last for longer than a few 104 yr.
4.3. Discussion
Different scenarios can qualitatively explain the OI enrichment of the HD 172555 disc. We note that these are not necessarily mutually exclusive since gas accumulation could follow the giant collision proposed by Lisse et al. (2009), if it did not occur too recently. For instance, it takes about 1 Myr for the debris created in a giant impact to form an axisymmetric disc (Jackson & Wyatt 2012), and be consistent with observational constraints (Smith et al. 2012). This may leave sufficient time to accumulate OI gas at some place in the disc. Additional processes, such as comet evaporation or grain photodesorption (Chen et al. 2007), also deserve to be mentioned as possible OI providers. In summary, the origin of the detected OI gas remains open, and detailed modelling of the processes discussed here, as well as the detection of atomic or ionized Fe, Mg, and Si will help to identify the source of OI gas.
5. Summary and conclusion
Our main results can be summarized as follows:
-
1.
We report the detection of the [OI] line in the de-bris disc of HD 172555 with a flux of(9.2 ± 2.4) × 10-18W/m2. This is the first unambiguous detection of gas in this system.
-
2.
We modelled the SED of the object with a Kurucz photospheric model (Teff = 7800 K, log g = 4.5, Lstar = 7.8 L⊙) plus a modified blackbody to fit the infrared excess at λ > 7 μm. We obtain Tdust = 280 K and β = 0.2. We derive a dust mass of ~4.8 × 10⁻⁴ M⊕.
-
3.
Using purely analytical relations and simple assumptions, we derive an [OI] mass of 2.5 × 10⁻²R2 M⊕ where R is the unconstrained radial location of the gas.
-
4.
Although the spatial origin of the line is uncertain, we speculate about a possible origin in an hypervelocity collision, or in gas accumulation over time due to the low radiation pressure on atomic oxygen.
-
5.
HD 172555 provides a valuable window on the processes that occur during the early stages of terrestrial planet formation, including massive collisions like the one that produced Earth’s moon (Canup & Esposito 1996).
Online material
Appendix A: HD 172555 photometry compilation
Table A.1 shows a compilation of current literature and Herschel photometry for HD 172555.
Available photometry.
Appendix B: How to derive the oxygen mass
In the following we explain how to derive the atomic oxygen gas mass from prompt
emission level population. To estimate the mass of oxygen gas we consider the excitation
of atomic oxygen to its first fine structure level in the absence of a collisional
partner. This situation happens in very low density environments such as debris discs.
The main mechanism involved is the so-called prompt emission and fluorescence. The
prompt emission involves the absorption of a photon from the star or from the dust at
the precise wavelength of the atomic emission, and subsequent re-emission. To model the
emission, we assume that the ground state is the most populated. The population at
steady-state for level  is given
by:
is given
by:  (B.1)Assuming that only the
first two levels are populated
(n = n0 + n1),
(B.1)Assuming that only the
first two levels are populated
(n = n0 + n1),
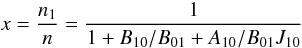 (B.2)since
g0B01 = g1B10
and
B10 = (c2/2hν3)A10,
the fractional population is
(B.2)since
g0B01 = g1B10
and
B10 = (c2/2hν3)A10,
the fractional population is 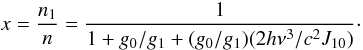 (B.3)For OI we have
g0 = 5, g1 = 3.
J10 is computed using the distance-dilluted stellar flux
in the Rayleigh-Jeans regime at 63 μm:
(B.3)For OI we have
g0 = 5, g1 = 3.
J10 is computed using the distance-dilluted stellar flux
in the Rayleigh-Jeans regime at 63 μm:
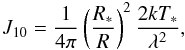 (B.4)where
R is the distance to the star and R∗
the stellar radius. We obtain
J10 = 2.273 × 10-13 × (1 AU/
R(AU))2 erg s-1 cm-2 Hz-1 sr-1,
and the fractional population is thus: x = 8.67 × 10⁻⁵
(B.4)where
R is the distance to the star and R∗
the stellar radius. We obtain
J10 = 2.273 × 10-13 × (1 AU/
R(AU))2 erg s-1 cm-2 Hz-1 sr-1,
and the fractional population is thus: x = 8.67 × 10⁻⁵
The number of oxygen atoms given the flux in cgs is then
![Mathematical equation: \appendix \setcounter{section}{2} \begin{equation} {N_{\rm [OI]}}= 9.5216\times 10^{36} \frac{F_{\rm line}\left({\rm erg\ s^{-1} \ cm}^{-2}\right)\times D^2\left({\rm pc}^2 \right)} {\frac{h\nu} {4\pi}A_{ul}\ x} R\left({\rm AU}\right)^{2}, \end{equation}](/articles/aa/full_html/2012/10/aa19745-12/aa19745-12-eq130.png) (B.5)where
9.5216 × 1036 combines the conversion from arcsec2 to steradian
and from AU to parsec.
(B.5)where
9.5216 × 1036 combines the conversion from arcsec2 to steradian
and from AU to parsec.
The effect of including additional excitation paths is negligible. We compare this with
a situation when the emission is produced at 1 AU from the star. For example, if we
include all main fluorescence pumping paths ( →
→
 →
→
 ,
,
 →
→
 →
, and
→
→
, and
→
 →
→
), the final
mass of oxygen is
M([OI] ) = 0.0247 M⊕, compared to
M([OI] ) = 0.025 M⊕ obtained when
we only include the main excitation path.
→
→
), the final
mass of oxygen is
M([OI] ) = 0.0247 M⊕, compared to
M([OI] ) = 0.025 M⊕ obtained when
we only include the main excitation path.
Acknowledgments
This research has been funded by Spanish grants AYA 2010-21161-C02-02, CDS2006-00070 and PRICIT-S2009/ESP-1496. J.-C. Augereau and J. Lebreton thank the ANR (contract ANR-2010 BLAN-0505-01, EXOZODI) and the CNES-PNP for financial support. C. Pinte, F. Menard and W.-F. Thi acknowledges funding from the EU FP7-2011 under Grant Agreement nr. 284405. G. Meeus is supported by RYC-2011-07920. G. Meeus, C. Eiroa, I. Mendigutía and B. Montesinos are partly supported by AYA-2011-26202. F.M. acknowledges support from the Millennium Science Initiative (Chilean Ministry of Economy), through grant ÒNucleus P10-022-FÓ.
References
- Barrado y Navascués, D., Stauffer, J. R., Song, I., & Caillault, J.-P. 1999, ApJ, 520, L123 [NASA ADS] [CrossRef] [Google Scholar]
- Bayo, A., Rodrigo, C., Barrado Y Navascués, D., et al. 2008, A&A, 492, 277 [NASA ADS] [CrossRef] [EDP Sciences] [Google Scholar]
- Beckwith, S. V. W., Sargent, A. I., Chini, R. S., & Guesten, R. 1990, AJ, 99, 924 [NASA ADS] [CrossRef] [Google Scholar]
- Canup, R. M., & Esposito, L. W. 1996, Icarus, 119, 427 [NASA ADS] [CrossRef] [Google Scholar]
- Chen, C. H., Sargent, B. A., Bohac, C., et al. 2006, ApJS, 166, 351 [NASA ADS] [CrossRef] [Google Scholar]
- Chen, C. H., Li, A., Bohac, C., et al. 2007, ApJ, 666, 466 [NASA ADS] [CrossRef] [Google Scholar]
- Cote, J. 1987, A&A, 181, 77 [NASA ADS] [Google Scholar]
- Czechowski, A., & Mann, I. 2007, ApJ, 660, 1541 [NASA ADS] [CrossRef] [Google Scholar]
- Dent, W. R. F., Greaves, J. S., & Coulson, I. M. 2005, MNRAS, 359, 663 [NASA ADS] [CrossRef] [Google Scholar]
- Feigelson, E. D., Lawson, W. A., Stark, M., Townsley, L., & Garmire, G. P. 2006, AJ, 131, 1730 [NASA ADS] [CrossRef] [Google Scholar]
- Fernández, R., Brandeker, A., & Wu, Y. 2006, ApJ, 643, 509 [NASA ADS] [CrossRef] [Google Scholar]
- Gray, R. O., Corbally, C. J., Garrison, R. F., et al. 2006, AJ, 132, 161 [NASA ADS] [CrossRef] [Google Scholar]
- Hauck, B., & Mermilliod, M. 1998, A&AS, 129, 431 [NASA ADS] [CrossRef] [EDP Sciences] [Google Scholar]
- Høg, E., Fabricius, C., Makarov, V. V., et al. 2000, A&A, 355, L27 [NASA ADS] [Google Scholar]
- Ishihara, D., Onaka, T., Kataza, H., et al. 2010, A&A, 514, A1 [NASA ADS] [CrossRef] [EDP Sciences] [Google Scholar]
- Jackson, A. P., & Wyatt, M. C. 2012, MNRAS, 425, 657 [NASA ADS] [CrossRef] [Google Scholar]
- Johnson, H. L., Mitchell, R. I., Iriarte, B., & Wisniewski, W. Z. 1966, Communications of the Lunar and Planetary Laboratory, 4, 99 [Google Scholar]
- Lebreton, J., Augereau, J.-C., Thi, W.-F., et al. 2012, A&A, 539, A17 [NASA ADS] [CrossRef] [EDP Sciences] [Google Scholar]
- Lisse, C. M., Chen, C. H., Wyatt, M. C., & Morlok, A. 2008, in Lun. Planet. Inst. Techn. Rep. 39, Lunar and Planetary Institute Science Conference Abstracts, 2119 [Google Scholar]
- Lisse, C. M., Chen, C. H., Wyatt, M. C., et al. 2009, ApJ, 701, 2019 [NASA ADS] [CrossRef] [Google Scholar]
- Löhne, T., Augereau, J.-C., Ertel, S., et al. 2012, A&A, 537, A110 [NASA ADS] [CrossRef] [EDP Sciences] [Google Scholar]
- Moerchen, M. M., Telesco, C. M., & Packham, C. 2010, ApJ, 723, 1418 [NASA ADS] [CrossRef] [Google Scholar]
- Moór, A., Ábrahám, P., Juhász, A., et al. 2011, ApJ, 740, L7 [NASA ADS] [CrossRef] [Google Scholar]
- Nilsson, R., Liseau, R., Brandeker, A., et al. 2009, A&A, 508, 1057 [NASA ADS] [CrossRef] [EDP Sciences] [Google Scholar]
- Pahlevan, K., Stevenson, D. J., & Eiler, J. M. 2011, Earth Planet. Sci. Lett., 301, 433 [NASA ADS] [CrossRef] [Google Scholar]
- Pilbratt, G. L., Riedinger, J. R., Passvogel, T., et al. 2010, A&A, 518, L1 [CrossRef] [EDP Sciences] [Google Scholar]
- Poglitsch, A., Waelkens, C., Geis, N., et al. 2010, A&A, 518, L2 [NASA ADS] [CrossRef] [EDP Sciences] [Google Scholar]
- Rebull, L. M., Stapelfeldt, K. R., Werner, M. W., et al. 2008, ApJ, 681, 1484 [NASA ADS] [CrossRef] [Google Scholar]
- Roberge, A., Feldman, P. D., Weinberger, A. J., Deleuil, M., & Bouret, J.-C. 2006, Nature, 441, 724 [NASA ADS] [CrossRef] [PubMed] [Google Scholar]
- Schütz, O., Meeus, G., & Sterzik, M. F. 2005, A&A, 431, 175 [NASA ADS] [CrossRef] [EDP Sciences] [Google Scholar]
- Skrutskie, M. F., Cutri, R. M., Stiening, R., et al. 2006, AJ, 131, 1163 [NASA ADS] [CrossRef] [Google Scholar]
- Smith, R., Wyatt, M. C., & Haniff, C. A. 2012, MNRAS, 422, 2560 [NASA ADS] [CrossRef] [Google Scholar]
- Takasawa, S., Nakamura, A. M., Kadono, T., et al. 2011, ApJ, 733, L39 [NASA ADS] [CrossRef] [Google Scholar]
- Wyatt, M. C. 2005, A&A, 433, 1007 [NASA ADS] [CrossRef] [EDP Sciences] [Google Scholar]
- Wyatt, M. C., Smith, R., Su, K. Y. L., et al. 2007, ApJ, 663, 365 [NASA ADS] [CrossRef] [Google Scholar]
- Yi, S., Demarque, P., Kim, Y.-C., et al. 2001, ApJS, 136, 417 [NASA ADS] [CrossRef] [Google Scholar]
- Zuckerman, B., & Song, I. 2004, ARA&A, 42, 685 [NASA ADS] [CrossRef] [MathSciNet] [Google Scholar]
All Tables
All Figures
|
Fig. 1 HD 172555 SED. The dashed line represents the photospheric contribution fitted using VOSA (Bayo et al. 2008) with Teff = 7800 K, log g = 4.5, Lstar = 7.8 L⊙, while the solid one represents a photosphere plus modified blackbody model with T = 280 K and β = 0.2. Blue dots represent Heschel/PACS photometric points. |
| In the text | |
|
Fig. 2 [OI] |
| In the text | |
|
Fig. 3 HR diagram for HD 172555. Dashed lines depict the position of the theoretical isochrones for different ages (Yi et al. 2001) while solid lines depict evolutionary tracks for different stellar masses. |
| In the text | |
Current usage metrics show cumulative count of Article Views (full-text article views including HTML views, PDF and ePub downloads, according to the available data) and Abstracts Views on Vision4Press platform.
Data correspond to usage on the plateform after 2015. The current usage metrics is available 48-96 hours after online publication and is updated daily on week days.
Initial download of the metrics may take a while.