| Issue |
A&A
Volume 544, August 2012
|
|
|---|---|---|
| Article Number | A111 | |
| Number of page(s) | 16 | |
| Section | Galactic structure, stellar clusters and populations | |
| DOI | https://doi.org/10.1051/0004-6361/201219314 | |
| Published online | 08 August 2012 | |
Online material
Appendix A: Photometric system in the RI-passbands of the 2-m TLS telescope
The CCD camera at the Schmidt focus of the 2-m telescope of the TLS contains five filters of the Johnson-Cousins photometric system – UBVRI. Since we used only R- and I-bands, we discuss only these passbands here.
The TLS R-band of the camera is defined by a combination of three filter glasses (OG570/2 mm + KG3/2 mm + WG295/4 mm), whereas the I-band is reproduced with two filter glasses (RG780/3 mm and WG295/4 mm). The TLS RI-filter transmissions together with the SITe CCD sensitivity curve and Cousins/Bessel RI-passbands are shown in Fig. A.1. As one can see, the TLS R-filter reproduces well the original Cousins/Bessel R-passband designed for CCD-photometry (Bessell 1979), but the short wavelength cut-on of the TLS I-filter shifts it from the standard Cousins/Bessel I filter to 750 nm. The red edge of the I-bassband is open up to 1100 nm with over 90% transmission at wavelengths longer than 875 nm. Thus, a red fall-off is imposed by the 2k × 2k SITe detector passband.
A.1. Reduction of photometry
To transform the TLS instrumental magnitudes to the Johnson-Cousins standard system, we observed three Landolt fields – SA 101, 104, and 107 (Landolt 1992) – during all of the nights. Each of these fields contains several tens of standard stars. Our field of view included 28 standard stars in both SA 101 and SA 104 and 22 stars in SA 107. The SA-fields were observed at high and low zenith distances to correct our instrumental magnitudes for atmospheric extinction. Observations of an SA-field were on average repeated every 1.5 h. Because of the higher brightness of Landolt standard stars compared to our targets in Coma, the integration time of the SA fields was only 10 s (600 s for the cluster fields) and in the following reduction, fluxes of the standard stars were scaled to the exposure time of the cluster frames.
The calibration of the extracted instrumental magnitudes to the Landolt system was done in IRAF (“all-sky” method). We solved the transformation equations for standard stars of the form 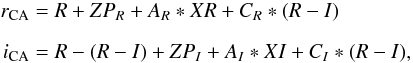 where R and R − I are the catalogue magnitude and colour of a standard star, ZPR and ZPI are zero-points of the R- and I-bands, AR and AI are the coefficients of atmospheric extinction in the proper bands, XR and XI are airmasses at a moment of observation, and CR and CI are the colour transformation coefficients. Solving the equations, we find the ZP and C coefficients and apply this solution to our programme stars, converting the TLS instrumental magnitudes to the Landolt system. Since we observed the standard stars every 1.5 h, we were able to check the atmospheric stability during the night. Our inspection showed that in some nights the extinction parameters changed considerably and we were not able to fit all observations of standard stars with the same equation. In these cases, we divided the observations into parts and fitted them separately.
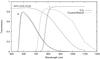 |
Fig. A.1
Filter responses and TLS SITe CCD sensitivity curve. The transmissions of the TLS photometric system are shown as thick solid lines for the R-filter, I-filter, and the SITe 2k × 2k CCD detector sensitivity curve. The dashed lines are RI-filter profiles from the Cousins/Bessel system (Bessell 1979). The red cut-off of the TLS I-passband is imposed by the red fall-off of the SITe CCD detector. |
| Open with DEXTER | |
At the same time, though we used Landolt standards to compute the photometric transformation, the resulting I-magnitudes are not in the Cousins system. As mentioned, this is due to the different passbands of the TLS and Cousins I-filter. Moreover, our set of Landolt fields contained stars mainly with R − I < 1.0, whereas our VLM/BD candidates have much redder colours, thus the colour transformation can be insufficient for those targets. Scholz & Eislöffel (2004) found that the I-band of the 2-m TLS telescope has a prominent shift relative to that of the Cousins system, which can reach 0.3 mag for objects with R − I > 1.5.
To correct this effect, we used the following procedure. We observed two Coma fields (C5 and D5) with three increasing exposure times of 10 s, 60 s, and 180 s. In the 10-s frames, we then selected several unsaturated stars photometrically observed by Deluca & Weis (1981) and Castelaz et al. (1991) as primary comparison stars. Using differential photometry, we computed magnitudes of all stars in these frames relative to each of the comparison stars. We selected about 10 fainter objects, averaged their magnitudes, and used them as secondary standards for the 60-s frames. To decrease the errors due to colour differences between the comparison stars and targets, we selected the secondary standards that are redder only at R − I ≈ 0.3 than their primary standards. In this way, we propagated the photometric system to our faint stars in the 600-s frames and finally, we determined magnitudes in 600-s C5- and D5-frames by differential photometry. In Fig. A.2 of the Appendix, we plotted the results against magnitudes calculated with the photometric method we used in the current work (“all-sky” method). As one can see, the difference between the methods for both the fields shows a clear dependence on the absolute values of the colour index. The difference is close to zero for stars with R − I = −0.5 and the correction for the “all-sky” method reaches  near R − I = 2.5. We then corrected the “all-sky” magnitudes using the obtained relationship. After this correction, the I − (R − I) and I − (I − J) CMDs (Fig. 2) show that in the range of the colour indices between 1
 5 and 25 the corrected magnitudes agree with the 500 Myr isochrone from Baraffe et al. (1998).
 |
Fig. A.2
Comparison of I-band magnitudes computed with the differential photometry (Idiff) method and the “all-sky” method (used in the current work). The comparison is based on two Coma fields (C5 and D5). The difference between I-magnitudes calculated with these methods increases monotonically with growing R − I and reaches ~ 0.25 at R − I = 2.5. This difference could be due to different passbands of the TLS and Cousins/Bessel photometric systems and partly because the colours of the Landolt standards are not red enough for BD/VLM objects. |
| Open with DEXTER | |
Analysing the photometry, we also found a slight discrepancy between the photometric zero points of several CCD frames within the mosaic. The nature of the effects can be variable sky conditions, for instance, such as areas of thin cirrus that are almost invisible during the night time. A zero point correction was empirically computed from overlapping regions of frames using those obtained during good photometric conditions as references, and applied to the RI-magnitudes of the objects in our output photometric data.
Appendix B: Coma open cluster member candidates
In Table B.1, we provide a list of 82 optically selected Coma Berenices open cluster member candidates inferred from an I − (R − I) CMD that were selected for follow up based on 2MASS JHKs photometry and proper motion analysis.
RI- and 2MASS JHKs photometry of Coma open cluster member candidates.
© ESO, 2012
Current usage metrics show cumulative count of Article Views (full-text article views including HTML views, PDF and ePub downloads, according to the available data) and Abstracts Views on Vision4Press platform.
Data correspond to usage on the plateform after 2015. The current usage metrics is available 48-96 hours after online publication and is updated daily on week days.
Initial download of the metrics may take a while.