Fig. A.1
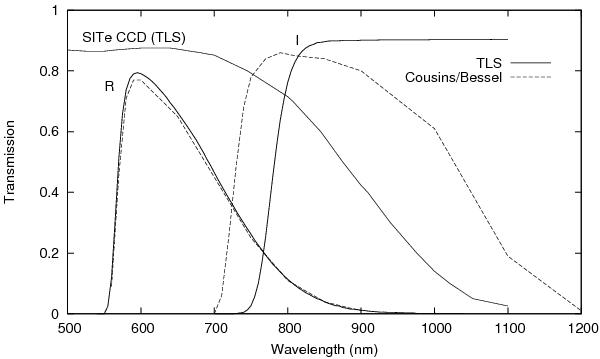
Filter responses and TLS SITe CCD sensitivity curve. The transmissions of the TLS photometric system are shown as thick solid lines for the R-filter, I-filter, and the SITe 2k × 2k CCD detector sensitivity curve. The dashed lines are RI-filter profiles from the Cousins/Bessel system (Bessell 1979). The red cut-off of the TLS I-passband is imposed by the red fall-off of the SITe CCD detector.
Current usage metrics show cumulative count of Article Views (full-text article views including HTML views, PDF and ePub downloads, according to the available data) and Abstracts Views on Vision4Press platform.
Data correspond to usage on the plateform after 2015. The current usage metrics is available 48-96 hours after online publication and is updated daily on week days.
Initial download of the metrics may take a while.