| Issue |
A&A
Volume 544, August 2012
|
|
|---|---|---|
| Article Number | A67 | |
| Number of page(s) | 30 | |
| Section | Stellar atmospheres | |
| DOI | https://doi.org/10.1051/0004-6361/201118594 | |
| Published online | 27 July 2012 | |
Online material
Appendix A: Best fits
In this Appendix we present our best-fit models to the optical and UV spectra for the eight stars in our sample. The wavelength range between 1200 and 1225 Å was not used in the spectral analysis since it suffers from a strong interstellar Lyman absorption. Nevertheless, we take this interstellar absorption into account by adding the effects of a representative hydrogen column density to our synthetic spectra in our final plots.
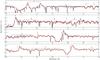 |
Fig. A.1
Best-fit model for HD 190429A (red line) compared to FUSE and IUE spectra (black line). |
| Open with DEXTER | |
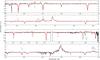 |
Fig. A.2
Best-fit model for HD 190429A (red line) compared to the ELODIE spectrum (black line). |
| Open with DEXTER | |
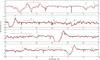 |
Fig. A.3
Best-fit model for HD 66811 (red line) compared to Copernicus and IUE spectra (black line). |
| Open with DEXTER | |
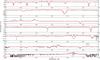 |
Fig. A.4
Best-fit model for HD 66811 (red line) compared to the FEROS spectrum (black line). |
| Open with DEXTER | |
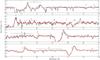 |
Fig. A.5
Best-fit model for HD 16691 (red line) compared to FUSE and IUE spectra (black line). |
| Open with DEXTER | |
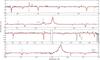 |
Fig. A.6
Best-fit model for HD 16691 (red line) compared to the ELODIE spectrum (black line). |
| Open with DEXTER | |
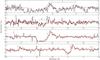 |
Fig. A.7
Best-fit model for HD 15570 (red line) compared to FUSE and IUE spectra (black line). |
| Open with DEXTER | |
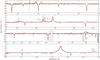 |
Fig. A.8
Best-fit model for HD 15570 (red line) compared to the ELODIE spectrum (black line). |
| Open with DEXTER | |
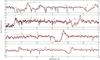 |
Fig. A.9
Best-fit model for HD 14947 (red line) compared to FUSE and IUE spectra (black line). |
| Open with DEXTER | |
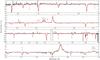 |
Fig. A.10
Best-fit model for HD 14947 (red line) compared to the ELODIE spectrum (black line). |
| Open with DEXTER | |
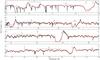 |
Fig. A.11
Best-fit model for HD 210839 (red line) compared to FUSE and IUE spectra (black line). |
| Open with DEXTER | |
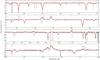 |
Fig. A.12
Best-fit model for HD 210839 (red line) compared to the NARVAL spectrum (black line). |
| Open with DEXTER | |
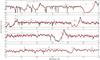 |
Fig. A.13
Best-fit model for HD 163758 (red line) compared to FUSE and IUE spectra (black line). |
| Open with DEXTER | |
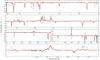 |
Fig. A.14
Best-fit model for HD 163758 (red line) compared to the UVES spectrum (black line). |
| Open with DEXTER | |
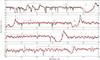 |
Fig. A.15
Best-fit model for HD 192639 (red line) compared to FUSE and IUE spectra (black line). |
| Open with DEXTER | |
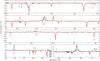 |
Fig. A.16
Best-fit model for HD 192639 (red line) compared to the ELODIE spectrum (black line). |
| Open with DEXTER | |
© ESO, 2012
Current usage metrics show cumulative count of Article Views (full-text article views including HTML views, PDF and ePub downloads, according to the available data) and Abstracts Views on Vision4Press platform.
Data correspond to usage on the plateform after 2015. The current usage metrics is available 48-96 hours after online publication and is updated daily on week days.
Initial download of the metrics may take a while.