| Issue |
A&A
Volume 542, June 2012
|
|
|---|---|---|
| Article Number | A39 | |
| Number of page(s) | 22 | |
| Section | Galactic structure, stellar clusters and populations | |
| DOI | https://doi.org/10.1051/0004-6361/201118099 | |
| Published online | 01 June 2012 | |
Online material
Appendix A: Morphology of galaxies and distribution of cluster complexes
The K-band images of the ten grand-design, spiral galaxies in the sample are shown in Fig. A.1 as direct images, while θ-ln(r) representations are given in Fig. A.2. A short description of their spiral structure is given below based on the Fourier analysis of the azimuthal intensity variation in their de-projected disks.
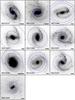 |
Fig. A.1
Ks-maps of all the galaxies in the sample in negative representation. Both intensity and angular scale have been varied to help enhance the spiral structure in the galaxies. The two dashed ellipses indicate the radial region of the main, symmetric spiral pattern. All images are orientated with north to the top and east to the left with a scale indicated by the 30′′ bar in the lower right corner. |
| Open with DEXTER | |
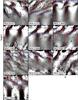 |
Fig. A.2
Θ-ln(r) maps of the galaxies showing the variation relative to the radial Ks intensity profile using the projection angles listed in Table 1. A negative gray scale is used from 0.5 (white) to 1.5 (black). A spherical bulge component was fitted and removed before de-projecting the galaxies. The azimuthal angle spans 2π starting from the position angle of the galaxy while the radius begins at 5′′. The two dashed lines indicate the radial range of the symmetric, logarithmic spiral pattern identical to the two ellipses in Fig. A.1. The phase of the m = 2 Fourier component is given by dots. |
| Open with DEXTER | |
- NGC 157:
the galaxy has a weak oval distortion atits center, which reaches to a radius of around10′′ and has a relative amplitude ofa2 ≈ 2%. There is a transition zone to 20′′, where a two-armed, logarithmic spiral with a pitch angle of 33.4° starts. Its relative amplitude peaks around 40% in the range 30′′ < r < 50′′. The main m = 2 pattern terminates close to 60′′, outside which a weaker, tighter pattern exists.
- NGC 1232:
it has been argued that this galaxy has a morphology similar to that of our Milky Way (Becker & Fenkart 1970). It has a bar out to a radius of 16′′ with a2 = 20%. A tight, symmetric, two-armed spiral with (a2, i) = (0.2, 14.7°) emerges from the end of the bar. Its symmetric part terminates at r = 36″, after which the northern arm splits as the southern arm continues. A more open pattern can be traced to 120′′.
- NGC 1300:
there are indications of a weak central bar with a2 = 10% within 8′′. The main bar reaches an amplitude a2 = 55% around 64′′, where it widens into ansae. A tightly wound set of arms emerges from the end of the bar close to 95′′, while a faint spiral pattern can be traced outside 150′′ with (a2, i) = (0.2, 13.7°). A dynamical study by Patsis et al. (2010) suggests that the inner arms are supported by stars on chaotic orbits.
- NGC 1365:
a spiral structure occupies the central parts, while the bar is seen in the range 40–92′′ with an amplitude a2 up to 73%. The main spiral starts at the ends of the bar and follows a logarithmic spiral with i = 33.1° from 99′′ to the edge of the frame around 220′′. The amplitude of its m = 2 component exceeds unity in the outer parts owing to its strongly peaked, azimuthal shape.
- NGC 1566:
the central part hosts a weak oval distortion with a position angle of 3˜0°. Two symmetric regions in the radial range of 15–35′′ and N-S direction show strong star formation activity. The arms connect to these regions but the logarithmic spiral first starts at r = 49′′ with (a2, i) = (0.7, 27.1°). Outside 99′′, the spiral pattern changes shape.
- NGC 2997:
besides a ring of star-forming regions at the center, a bar with a2 = 10% ends around 45′′, where the main spiral emerges with (a2, i) = (0.4, 21.2°). The regular logarithmic spiral pattern terminates close to 125′′, where the southern arm has an abrupt turn.
- NGC 4030:
the inner part has a complex structure with multiple spiral arms. The main symmetric, two-armed spiral pattern is located in the region 49–70′′ with (a2, i) = (0.3, 26.5°).
- NGC 4321:
the inner part of NGC 4321 is occupied by a central bar inside 13′′, a main bar to around 67′′ and several ring/spiral structures. A set of prominent spiral arms starts at the end of the bar but these are asymmetric (with a much stronger southern arm) and tightly wound, in a similar way to those of NGC 1300. Close to 99′′, a logarithmic spiral can be traced to 134′′ with the parameters (a2, i) = (0.5, 29.1°).
- NGC 5247:
the spiral pattern of this galaxy, as for that of NGC 1566, is a prototype clean, open m = 2 logarithmic spiral. There is evidence of both a central bar within 5′′ and a weak spiral pattern reaching 8′′ that has the opposite winding of the main spiral. After a transition zone, the main spiral pattern follows a logarithmic spiral with (a2, i) = (0.6, 34.4°) in the range 40′′ to 121′′. There is a small phase shift around 100′′. The azimuthal profile is peaked with significant amplitudes of higher-order even harmonics.
- NGC 7424:
this galaxy is the closest in the sample with a distance of 9.5 Mpc. With a linear resolution of 20 pc, most sources are likely to be associated with individual clusters. There are no traces of either significant dust lanes or large star-forming regions. Its bar extends to 38′′, where a tight spiral emerges at an angle of almost 90°. The main set of symmetric arms starts around 49′′ with (a2, i) = (0.3, 12.3°) and terminates at 77′′. Another tight spiral can be traced out to 90′′ with (a2, i) = (0.1, 9.0°). The spirals have a smooth, azimuthal shape with little power at higher frequencies than m = 2.
 3 are shown in Fig. A.3, where compact complexes (0.3 < cs < 0.95) are plotted as red points and diffuse ones (cs < 0.3) as blue triangles. The diffuse objects outline the main spiral structure more clearly than the compact ones which are more uniformly distributed. This is mainly due to a larger fraction of compact sources having Qd < 01 and therefore being older on average than the diffuse sources.
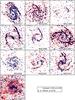 |
Fig. A.3
Positions of all non-stellar sources with photometric errors < 0 |
| Open with DEXTER | |
Appendix B: Color and magnitude diagrams
The (H − K) – (J − H) diagrams of non-stellar sources in the galaxies are given in Fig. B.1, where colors represent their MK. For reference, the “screen” and “dusty” reddening vectors and cluster evolutionary tracks are indicated in Fig. 5. They have the same general features as those described in Sect. 4 but there is a significant variation in their relative importance. To a large extent, this is due to differences in the limiting magnitude since the “older” clump is dominated by faint sources. The average location of the high extinction clump varies mainly in (J − H), which may be explained by slight changes in the effective extinction law applicable to the complexes.
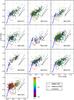 |
Fig. B.1
(H − K) – (J − H) diagrams for non-stellar sources with errors < 0 |
| Open with DEXTER | |
The Qd – MK diagrams are presented in Fig. B.2 with the standard SB99 SSP model for a cluster of 105 M⊙. All the galaxies except for NGC 7424 have complexes reaching absolute magnitudes MK close to –15m. NGC 1365 and NGC 4321 have several brighter sources, which all are located in their central regions. The brightest complexes are found near Qd = 00 but would be shifted to slightly higher luminosities if extinction corrections were applied. The decreasing number of sources moving from Qd = 00 to higher values is caused by the youngest objects, with higher Qd, still forming stars and increasing their luminosity. Nebular emission also yields higher Qd measures. Although the standard cluster tracks only reach Qd = –03, clusters with values up to –07 are observed in the LMC-SMC (Pessev et al. 2006), which can explain the negative tail of Qd.
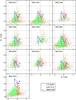 |
Fig. B.2
Absolute Ks-band magnitude MK of all non-stellar sources with errors < 0 |
| Open with DEXTER | |
Color–magnitude diagrams for (J − K) – MK are provided in Fig. B.3 with the standard SB99 SSP model as reference. The younger population (red/dark) is more prominent for high (J − K) values which are indicative of higher extinctions. As discussed in the main section, young clusters should have lower intrinsic (J − K) values than older ones. That they actually have higher values suggests that they are highly obscured. Double peaks are clearly seen for NGC 157, NGC 1566, NGC 2997, and NGC 7424, while only marginal ones are visible for NGC 1232 and NGC 5247. A clear gap indicates a rapid expulsion of dust from young clusters, while the lack of one could be caused by both a slower expulsions and a wider spread in attenuation by dust. The left edge of the distribution is fairly sharp and
corresponds well to the cluster track. This indicates that many older clusters have low internal extinction.
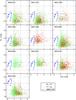 |
Fig. B.3
Absolute Ks-band magnitude MK of all non-stellar sources with errors < 0 |
| Open with DEXTER | |
Appendix C: Spatial distribution of complexes
The radial surface density of non-stellar sources is displayed in Fig. C.1, where red (dark) indicates younger and yellow (light) older ones. All galaxies show a steep decline in their outer parts, while some (e.g. NGC 157, NGC 1365, NGC 2997, NGC 4321, NGC 5247, and NGC 7424) have a relative flat part in their disks. The distributions of younger and older complexes follow each other well indicating that current and past SFRs display little radial change.
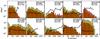 |
Fig. C.1
Surface density of non-stellar sources with photometric errors < 0 |
| Open with DEXTER | |
The locations of complexes relative to the spiral arms are given in Fig. C.2, which plots MK and Qd against the azimuthal distance Δθ from the phase of the m = 2 FFT component. Only
sources in the radial range of the strong, grand-design spiral pattern (listed in the upper right corner) and photometric errors < 03 are shown. The modulation of the source density with azimuthal angle from the spiral arms is stronger for the galaxies with strong, grand-design patterns such as NGC 157, NGC 1365, NGC 1566, NGC 2997, and NGC 5247. Both NGC 1232 and NGC 7424 have relatively weak spiral perturbations, whereas the radial regions for NGC 4030 and NGC 4321 are located in their outer parts, which have less star-formation activity. As the Kolmogorov-Smirnov tests show, the shape of the distribution of Qd (i.e. age) does not change significantly from arm to inter-arm regions. On the other hand, the excess of bright sources in the arms seems real.
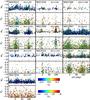 |
Fig. C.2
Absolute magnitude MK and Qd index of non-stellar sources with errors σ(H − K) < 0 |
| Open with DEXTER | |
© ESO, 2012
Current usage metrics show cumulative count of Article Views (full-text article views including HTML views, PDF and ePub downloads, according to the available data) and Abstracts Views on Vision4Press platform.
Data correspond to usage on the plateform after 2015. The current usage metrics is available 48-96 hours after online publication and is updated daily on week days.
Initial download of the metrics may take a while.