Fig. C.1
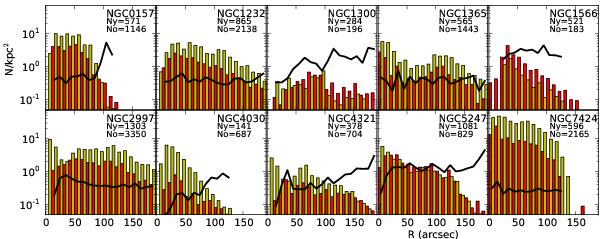
Surface density of non-stellar sources with photometric errors < 0 5. Total numbers of young objects, Ny, (with 01 < Q) and older ones, No, (with Q < 01) are listed for each galaxy. Red (dark) bars represent young objects, while older ones are indicated in yellow (light). The ratio of young to old clusters is plotted as a full drawn curve.
Current usage metrics show cumulative count of Article Views (full-text article views including HTML views, PDF and ePub downloads, according to the available data) and Abstracts Views on Vision4Press platform.
Data correspond to usage on the plateform after 2015. The current usage metrics is available 48-96 hours after online publication and is updated daily on week days.
Initial download of the metrics may take a while.