Fig. B.1
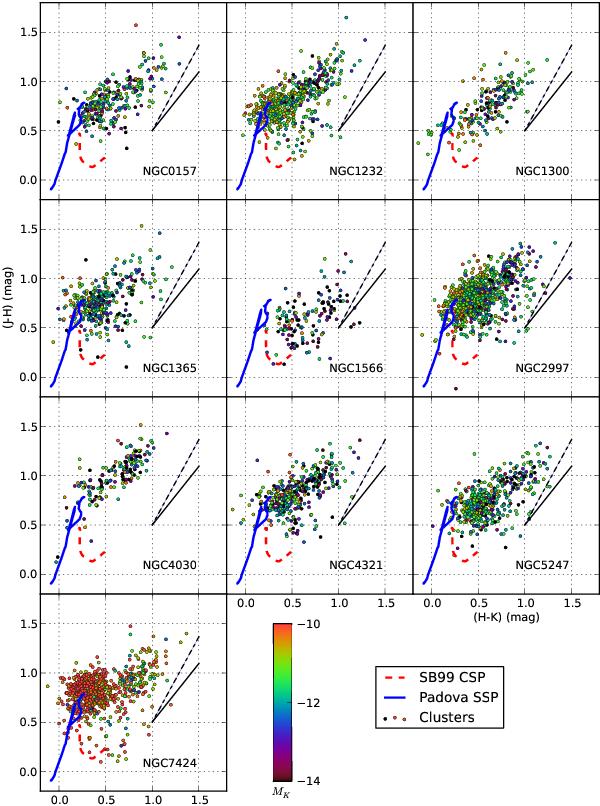
(H − K) – (J − H) diagrams for non-stellar sources with errors < 0 05. The blue full-drawn line show an evolutionary track of a Padova SSP model, while the red dashed line indicates a corresponding SB99 CSP model (for details see Fig. 5). The two black lines show the directions of the reddening vectors for “screen” and “dusty” models (see Fig. 5). Colors indicate the MK of the clusters.
Current usage metrics show cumulative count of Article Views (full-text article views including HTML views, PDF and ePub downloads, according to the available data) and Abstracts Views on Vision4Press platform.
Data correspond to usage on the plateform after 2015. The current usage metrics is available 48-96 hours after online publication and is updated daily on week days.
Initial download of the metrics may take a while.