| Issue |
A&A
Volume 542, June 2012
|
|
|---|---|---|
| Article Number | A113 | |
| Number of page(s) | 29 | |
| Section | Stellar structure and evolution | |
| DOI | https://doi.org/10.1051/0004-6361/201117769 | |
| Published online | 19 June 2012 | |
Online material
Total energy (E), total number (N), and average wavelength ( ) of the ionizing photons for hydrogen (H), neutral helium (He) and singly ionized helium (He+) during the evolution for each model sequence.
Yields of stellar winds from rotating models, in units of solar mass.
Yields in the last calculated model for each model sequence, in units of solar mass.
Appendix A: Kippenhan diagram
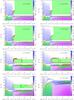 |
Fig. A.1
Kippenhahn diagram for different model sequences. The sequence number is shown in each diagram. Convective and overshooting layers are marked by green and yellow hatched lines, respectively. Semi-convective layers are marked by red dots. The net amount of energy loss and gain is indicated by color shading. The surface of the star is marked by a black solid line. |
| Open with DEXTER | |
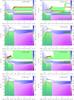 |
Fig. A.1
continued. |
| Open with DEXTER | |
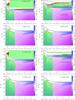 |
Fig. A.1
continued. |
| Open with DEXTER | |
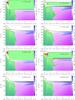 |
Fig. A.1
continued. |
| Open with DEXTER | |
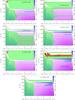 |
Fig. A.1
continued. |
| Open with DEXTER | |
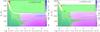 |
Fig. A.1
continued. |
| Open with DEXTER | |
© ESO, 2012
Current usage metrics show cumulative count of Article Views (full-text article views including HTML views, PDF and ePub downloads, according to the available data) and Abstracts Views on Vision4Press platform.
Data correspond to usage on the plateform after 2015. The current usage metrics is available 48-96 hours after online publication and is updated daily on week days.
Initial download of the metrics may take a while.