| Issue |
A&A
Volume 541, May 2012
|
|
|---|---|---|
| Article Number | A9 | |
| Number of page(s) | 25 | |
| Section | Stellar atmospheres | |
| DOI | https://doi.org/10.1051/0004-6361/201118598 | |
| Published online | 19 April 2012 | |
Online material
Appendix A: Data times series
In the following figures, we present the time series for all the parameters of the sample we used in this work. Black points are nightly averaged data points, red squares with errorbars are the 150-day bins, Δ is the peak-to-peak variation, and σ the standard deviation in the data. The errorbars are the error in the mean  , where N is the number of measurements in each bin.
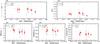 |
Fig. A.1
Time-series of RV, Na i index data, and the BIS, FWHM, and contrast of the CCF line profile for Gl 1. |
| Open with DEXTER | |
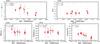 |
Fig. A.2
Time-series of RV, Na i index data, and the BIS, FWHM, and contrast of the CCF line profile for Gl 176. |
| Open with DEXTER | |
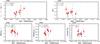 |
Fig. A.3
Time-series of RV, Na i index data, and the BIS, FWHM, and contrast of the CCF line profile for Gl 205. |
| Open with DEXTER | |
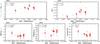 |
Fig. A.4
Time-series of RV, Na i index data, and the BIS, FWHM, and contrast of the CCF line profile for Gl 273. |
| Open with DEXTER | |
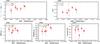 |
Fig. A.5
Time-series of RV, Na i index data, and the BIS, FWHM, and contrast of the CCF line profile for Gl 382. |
| Open with DEXTER | |
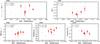 |
Fig. A.6
Time-series of RV, Na i index data, and the BIS, FWHM, and contrast of the CCF line profile for Gl 393. |
| Open with DEXTER | |
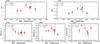 |
Fig. A.7
Time-series of RV, Na i index data, and the BIS, FWHM, and contrast of the CCF line profile for Gl 433. |
| Open with DEXTER | |
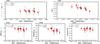 |
Fig. A.8
Time-series of RV, Na i index data, and the BIS, FWHM, and contrast of the CCF line profile for Gl 436. |
| Open with DEXTER | |
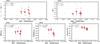 |
Fig. A.9
Time-series of RV, Na i index data, and the BIS, FWHM, and contrast of the CCF line profile for Gl 479. |
| Open with DEXTER | |
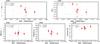 |
Fig. A.10
Time-series of RV, Na i index data, and the BIS, FWHM, and contrast of the CCF line profile for Gl 526. |
| Open with DEXTER | |
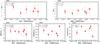 |
Fig. A.11
Time-series of RV, Na i index data, and the BIS, FWHM, and contrast of the CCF line profile for Gl 551. |
| Open with DEXTER | |
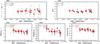 |
Fig. A.12
Time-series of RV, Na i index data, and the BIS, FWHM, and contrast of the CCF line profile for Gl 581. |
| Open with DEXTER | |
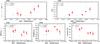 |
Fig. A.13
Time-series of RV, Na i index data, and the BIS, FWHM, and contrast of the CCF line profile for Gl 588. |
| Open with DEXTER | |
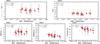 |
Fig. A.14
Time-series of RV, Na i index data, and the BIS, FWHM, and contrast of the CCF line profile for Gl 667C. |
| Open with DEXTER | |
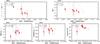 |
Fig. A.15
Time-series of RV, Na i index data, and the BIS, FWHM, and contrast of the CCF line profile for Gl 674. |
| Open with DEXTER | |
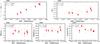 |
Fig. A.16
Time-series of RV, Na i index data, and the BIS, FWHM, and contrast of the CCF line profile for Gl 680. |
| Open with DEXTER | |
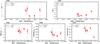 |
Fig. A.17
Time-series of RV, Na i index data, and the BIS, FWHM, and contrast of the CCF line profile for Gl 699. |
| Open with DEXTER | |
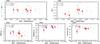 |
Fig. A.18
Time-series of RV, Na i index data, and the BIS, FWHM, and contrast of the CCF line profile for Gl 832. |
| Open with DEXTER | |
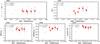 |
Fig. A.19
Time-series of RV, Na i index data, and the BIS, FWHM, and contrast of the CCF line profile for Gl 849. |
| Open with DEXTER | |
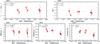 |
Fig. A.20
Time-series of RV, Na i index data, and the BIS, FWHM, and contrast of the CCF line profile for Gl 876. |
| Open with DEXTER | |
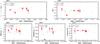 |
Fig. A.21
Time-series of RV, Na i index data, and the BIS, FWHM, and contrast of the CCF line profile for Gl 877. |
| Open with DEXTER | |
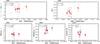 |
Fig. A.22
Time-series of RV, Na i index data, and the BIS, FWHM, and contrast of the CCF line profile for Gl 887. |
| Open with DEXTER | |
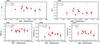 |
Fig. A.23
Time-series of RV, Na i index data, and the BIS, FWHM, and contrast of the CCF line profile for Gl 908. |
| Open with DEXTER | |
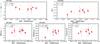 |
Fig. A.24
Time-series of RV, Na i index data, and the BIS, FWHM, and contrast of the CCF line profile for HIP 12961. |
| Open with DEXTER | |
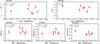 |
Fig. A.25
Time-series of RV, Na i index data, and the BIS, FWHM, and contrast of the CCF line profile for HIP 19394. |
| Open with DEXTER | |
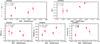 |
Fig. A.26
Time-series of RV, Na i index data, and the BIS, FWHM, and contrast of the CCF line profile for HIP 38594. |
| Open with DEXTER | |
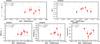 |
Fig. A.27
Time-series of RV, Na i index data, and the BIS, FWHM, and contrast of the CCF line profile for HIP 85647. |
| Open with DEXTER | |
© ESO, 2012
Current usage metrics show cumulative count of Article Views (full-text article views including HTML views, PDF and ePub downloads, according to the available data) and Abstracts Views on Vision4Press platform.
Data correspond to usage on the plateform after 2015. The current usage metrics is available 48-96 hours after online publication and is updated daily on week days.
Initial download of the metrics may take a while.