| Issue |
A&A
Volume 540, April 2012
|
|
|---|---|---|
| Article Number | A54 | |
| Number of page(s) | 22 | |
| Section | Extragalactic astronomy | |
| DOI | https://doi.org/10.1051/0004-6361/201118602 | |
| Published online | 26 March 2012 | |
Online material
Appendix A: Mutual correlations among the different physical parameters
The physical parameters used to trace the properties of the galaxies analysed in this work, although determined using independent data, can trace non completely independent variables. The SFR, the birthrate parameter b and the surface brightness of the ionising radiation Σ(Hα), for instance, are all strongly related to the present day star formation activity. The effective surface brightness μe(H) traces the distribution of the evolved stars dominating the stellar mass of galaxies. The total stellar mass is also necessary to estimate the birthrate parameter. A(Hα) and A(FUV) are two independent tracer of the dust extinction within galaxies. These different physical parameters might thus be mutually related, as shown in Fig. A.1 and Table A.1.
Figure A.1 shows a tight correlation between the surface brightness of the very evolved, cold stars μe(H) and the UV attenuation A(FUV) (r = − 0.57) indicating that in normal, star forming galaxies dust absorbs at the same time the photons emitted by the newly formed stars and by the most evolved stellar populations. Σ(Hα), SFR and b, as previously mentioned, are not fully independent tracers since all related with the present day star formation activity of galaxies. Surprisingly, however, the mutual relations between these parameters are very dispersed. The correlation between μe(H) and Σ(Hα) suggests that the surface density of all kind of stars increases independently of their age in the galaxies analysed in this work. Naturally, the two
independent dust extinction tracers A(Hα) and A(FUV) are mutually related (e.g. Calzetti 2001; Boselli et al. 2009). The trends observed between A(FUV) (and A(Hα)) and Σ(Hα) or μe(H) suggest that all the stellar radiation participates to the heating of the dust emitting in the far infrared. The relations with the metallicity index 12 + log (O/H) are weak (r ≃ 0.4–0.5), and suggest, as expected, that the dust extinction is more important in metal rich objects. They also show that the metallicity is coupled with the star formation history of galaxies (b), and is generally higher in high surface brightness evolved systems than in star forming, low surface brightness objects.
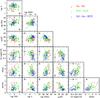 |
Fig. A.1
The relationships between the different parameters used to trace the physical properties characterizing the target galaxies: the logarithm of the star formation rate SFR (in M⊙ yr-1), the logarithm of the birthrate parameter b (or SSFR), the logarithm of the Hα effective surface brightness (in erg s-1 kpc-2), the H-band effective surface brightness (in AB mag arcsec-2), the metallicity index 12 + log (O/H), the Balmer decrement A(Hα) (in magnitudes) and the FUV attenuation A(FUV) (in magnitudes). Red open circles for Sa-Sb, green empty triangles for Sbc-Scd and blue open squares for Sd-Im-BCD. The typical error bar is indicated with a black cross. |
| Open with DEXTER | |
Appendix B: Colour–colour diagrams vs. physical parameters
To extend the analysis done in Sect. 4, we plot here for com pleteness all the colour–colour diagrams shown in Fig. 2 for galaxies coded according to different physical parameters. The codes used are the same than those used in Figs. 4–7, where the threshold in the physical parameters are: metal content 12 + log (O/H) = 8.55; Hα surface brightness log Σ(Hα) = 38.6 erg s-1 kpc-2; bir thrate parameter log b = 0.2; H-band effective surface brightness μe(H) = 19 AB mag arcsec-2; FUV attenuation A(FUV) = 1.4 mag. The general behaviors described in Sect. 4 can be observed also in the Figs. B.1–B.5.
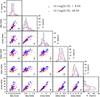 |
Fig. B.1
Far infrared colour–colour diagrams, equivalent to those shown in Fig. 2, with galaxies coded according to their mean metal content, with blue open circles for metal rich galaxies (12 + log (O/H) > 8.55) and red crosses for metal poor objects (12 + log (O/H) ≤ 8.55). The black histogram gives the distribution of all galaxies along the X-axis, while the coloured histograms those of the two subsamples of galaxies selected according to their metallicity. |
| Open with DEXTER | |
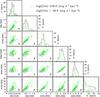 |
Fig. B.2
Far infrared colour–colour diagrams, equivalent to those shown in Fig. 2, with galaxies coded according to their Hα surface brightness, with green crosses for objects with log Σ(Hα) > 38.6 erg s-1 kpc-2 and grey open circles for galaxies with log Σ(Hα) ≤ 38.6 erg s-1 kpc-2. The black histogram gives the distribution of all galaxies along the X-axis, while the coloured histograms those of the two subsamples of galaxies selected according to their Hα surface brightness. |
| Open with DEXTER | |
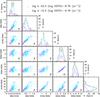 |
Fig. B.3
Far infrared colour–colour diagrams, equivalent to those shown in Fig. 2, with galaxies coded according to their birthrate parameter, with cyan open squares for objects with log b > 0.2 and magenta three points stars for galaxies with log b ≤ 0.2. The black histogram gives the distribution of all galaxies along the X-axis, while the coloured histograms those of the two subsamples of galaxies selected according to their birthrate parameter. |
| Open with DEXTER | |
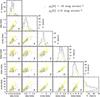 |
Fig. B.4
Far infrared colour–colour diagrams, equivalent to those shown in Fig. 2, with galaxies coded according to their effective surface brightness, with grey open triangles for objects with μe(H) > 19 mag arcsec-2 and yellow asterisks for galaxies with μe(H) ≤ 19 mag arcsec-2. The black histogram gives the distribution of all galaxies along the X-axis, while the coloured histograms those of the two subsamples of galaxies selected according to their H band effective surface brightness. |
| Open with DEXTER | |
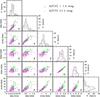 |
Fig. B.5
Far infrared colour–colour diagrams, equivalent to those shown in Fig. 2, with galaxies coded according to their FUV attenuation, magenta open circles for galaxies with a low attenuation (A(FUV) < 1.4) and green asterisks for objects wit A(FUV) ≥ 1.4. The black histogram gives the distribution of all galaxies along the X-axis, while the coloured histograms those of the two subsamples of galaxies selected according to their FUV attenuation. |
| Open with DEXTER | |
© ESO, 2012
Current usage metrics show cumulative count of Article Views (full-text article views including HTML views, PDF and ePub downloads, according to the available data) and Abstracts Views on Vision4Press platform.
Data correspond to usage on the plateform after 2015. The current usage metrics is available 48-96 hours after online publication and is updated daily on week days.
Initial download of the metrics may take a while.