Fig. B.3
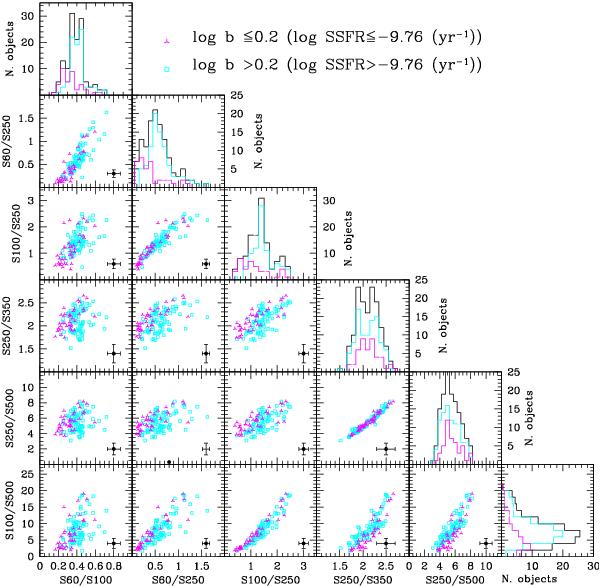
Far infrared colour–colour diagrams, equivalent to those shown in Fig. 2, with galaxies coded according to their birthrate parameter, with cyan open squares for objects with log b > 0.2 and magenta three points stars for galaxies with log b ≤ 0.2. The black histogram gives the distribution of all galaxies along the X-axis, while the coloured histograms those of the two subsamples of galaxies selected according to their birthrate parameter.
Current usage metrics show cumulative count of Article Views (full-text article views including HTML views, PDF and ePub downloads, according to the available data) and Abstracts Views on Vision4Press platform.
Data correspond to usage on the plateform after 2015. The current usage metrics is available 48-96 hours after online publication and is updated daily on week days.
Initial download of the metrics may take a while.