| Issue |
A&A
Volume 540, April 2012
|
|
|---|---|---|
| Article Number | A27 | |
| Number of page(s) | 20 | |
| Section | Galactic structure, stellar clusters and populations | |
| DOI | https://doi.org/10.1051/0004-6361/201118138 | |
| Published online | 20 March 2012 | |
Online material
Metallicities for globular clusters from R97 on the Carretta et al. (2009) scale.
Appendix A: Transformation between the AD91 and G09 measurements
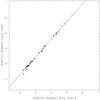 |
Fig. A.1
The sum of equivalent widths for the strongest two CaT lines measured with Gaussian-only fits are plotted here against the same quantity measured with Gaussian+Lorentzian fits. The latter are taken from the G09 paper, for stars in the clusters M 5 (+ signs), NGC 4372 (filled triangles), NGC 6752 (filled 5-point stars), NGC 6397 (open 5-point stars), NGC 6171 (open squares) and NGC 4590 (6-point stars). The interpolating line has slope f = 1.147, and it was obtained by minimizing residuals and imposing the passage through the origin. |
| Open with DEXTER | |
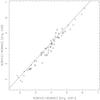 |
Fig. A.2
Same as Fig. A.1, for the stars observed for this work. The symbols identify NGC 3201 (open circles), M 10 (open triangles), M 4 (open diamonds), M 15 ( × signs) and M 71 (open squares). The fitting line has slope f = 1.090 and passes through the origin. |
| Open with DEXTER | |
We define the reduced equivalent width for a single star as W′ = S − a (V − VHB) where S = W8542 + W866210. So we can write for the (G)09 and (A)D91 systems: 
 and the averaged reduced equivalent widths are:
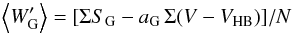
 By comparing measurements of individual S made with the G09 or the AD91 method, we found that SG = f SA, and by imposing a linear fit that is passing through (0,0) we found for clusters of the Leo I paper f = 1.147 (see Fig. A.1) and for clusters in this run f = 1.090 (see Fig. A.2). So then in the G09 system:
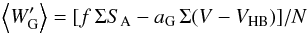
then we have  and with a substitution
  where for simplicity we wrote ΣHB = Σ(V − VHB). Rearranging and simplifying a bit more:
 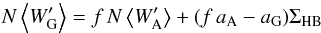 which gives
  as a function of f (with f = 1.090 or f = 1.147), the number of stars N measured for each cluster, the averaged reduced equivalent width in the AD91 system, the slopes aA and aG of the S vs. V − VHB relations in the two systems, and the sum of the magnitude differences with respect to the HB, ΣHB. The difference in slopes f is probably due to the fact that older spectra had a better resolution (slit of
  instead of 1″), so it might be that the Gauss-only fit does a worse job with line wings in that case.
© ESO, 2012
Current usage metrics show cumulative count of Article Views (full-text article views including HTML views, PDF and ePub downloads, according to the available data) and Abstracts Views on Vision4Press platform.
Data correspond to usage on the plateform after 2015. The current usage metrics is available 48-96 hours after online publication and is updated daily on week days.
Initial download of the metrics may take a while.