Fig. A.1
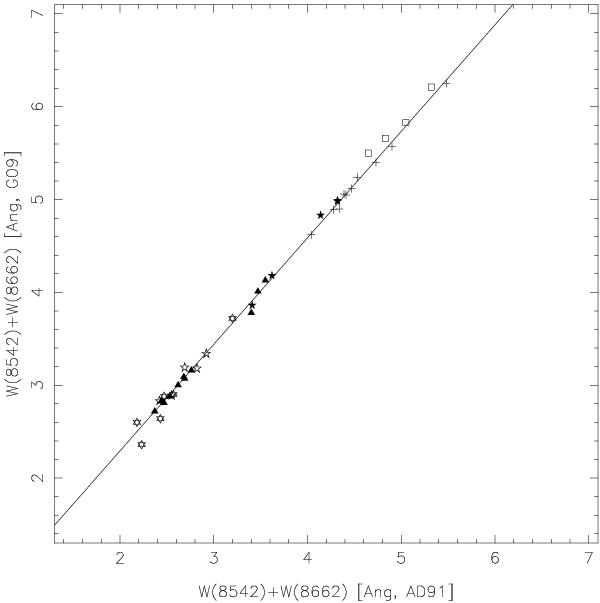
The sum of equivalent widths for the strongest two CaT lines measured with Gaussian-only fits are plotted here against the same quantity measured with Gaussian+Lorentzian fits. The latter are taken from the G09 paper, for stars in the clusters M 5 (+ signs), NGC 4372 (filled triangles), NGC 6752 (filled 5-point stars), NGC 6397 (open 5-point stars), NGC 6171 (open squares) and NGC 4590 (6-point stars). The interpolating line has slope f = 1.147, and it was obtained by minimizing residuals and imposing the passage through the origin.
Current usage metrics show cumulative count of Article Views (full-text article views including HTML views, PDF and ePub downloads, according to the available data) and Abstracts Views on Vision4Press platform.
Data correspond to usage on the plateform after 2015. The current usage metrics is available 48-96 hours after online publication and is updated daily on week days.
Initial download of the metrics may take a while.