| Issue |
A&A
Volume 540, April 2012
|
|
|---|---|---|
| Article Number | A57 | |
| Number of page(s) | 21 | |
| Section | Galactic structure, stellar clusters and populations | |
| DOI | https://doi.org/10.1051/0004-6361/201117637 | |
| Published online | 27 March 2012 | |
Online material
Appendix A: Correction of detector induced noise and ghost patterns
A.1. 50 Hz noise correction
Data obtained with the Aladdin3 detector is sporadically affected by the so-called 50 Hz noise, which is apparent as horizontal stripes, the intensity and position of which vary with time (Lundin et al. 2007, Chap. 5.1). To correct for this noise, an appropriate routine from the ESO ECLIPSE pipeline (Devillard 2001) for the ISAAC instrument was rewritten in IDL and adapted to the NACO data. It encompasses the following steps: 1.) Determine the median of each row after rejecting the 10 darkest and the 420 brightest pixels in order to exclude bad pixels and flux from stars, and store the median values in an array; 2.) Smooth the array of median values with a median filter with a half-width of 40 pixel; 3.) Subtract the difference between the original and the smoothed array of median flux values from each column of the image.
All data from 2008 except for the twilight flat fields were impaired by the 50 Hz noise. The correction routine was therefore applied to each reduced sky frame before they were combined to the master sky, and to each science frame after the subtraction of the corrected sky. The application of this routine after the basic reduction ensures that features due to dark current, detector bias and response are not altered by the 50 Hz noise correction, and are correctly removed using the dark and the twilight flat.
A.2. Treatment of electronic and optical ghosts
Very bright sources cause a regular pattern of electronic ghosts, the sizes and shapes of which depend on the detector array and the brightness of the inducing object. The minimum stellar peak flux in the raw images sufficient to generate a visible electronic ghost was about 2700 counts for all three 2.0 s DIT datasets. For the dataset with the longer DIT of 20.0 s the minimum flux was about 5500 counts, as ghosts of fainter stars are probably hidden within the brighter background. The location of the object on the detector array determines the position of these ghosts. A bright star at the position (x, y) causes electronic ghosts at (x, 1024-y), (1024-x, 1024-y) and (1024-x,y) (Ageorges et al. 2007, Chap. 4.7.1). For each science frame a mask covering the visible electronic ghosts was generated and added to the mask containing the bad pixels in the dark, the flat field, and bad pixels arising from cosmic ray hits. Pixels contained in the bad pixel masks are rejected by the drizzle algorithm during the image combination.
A few optical ghosts, apparent as sets of concentric rings with a radius of about 40 pixel ( ), are caused by the bright stars as well (Ageorges et al. 2007, Fig. 16). Unlike the electronic ghosts, the position of these ghosts seems to be fixed with respect to the observed star field, which prohibits a correction for these ghosts during the image combination, as they are placed on the same location in the combined image. As the brightness of stars, residing within an optical ghost, cannot be reliably determined these stars were later removed from all source catalogues.
Appendix B: Proper motion uncertainty
The uncertainty of the proper motion in the east-west (σμαcos(δ)) or north-south direction (σμδ) are computed as 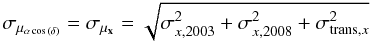 (B.1)and
 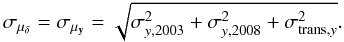 (B.2)The uncertainties of the position in the x- (east-west) and y-direction (north-south) in the proper motion plane (see Fig. 6) are denoted as σx, year and σy, year, respectively, and are the standard errors of the three independent measurements of the position of each star in the three auxiliary images (see Sect. 3.4). The residual rms deviations in the x- and y-direction of the geometric transformation, which is used to map the positions of the 2003 epoch onto the correct positions of the 2008 epoch, are σtrans, x and σtrans, y.
The proper motion membership criterion is derived from the total proper motion 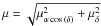 (see Sect. 5.3). The uncertainty of the combined proper motion σμ is therefore
 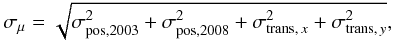 (B.3)where the astrometric uncertainty σpos,year is the average of the positional uncertainties in the x- and y-direction,
  (B.4)(see Sect. 3.4).
 |
Fig. B.1
Left panel: colour–magnitude diagram of stars classified as belonging to the field according to their proper motion (dots) and of stars removed from the member sample based on their colour or known spectral type (triangles). Field stars which could only be discerned due to the knowledge of their spectral type are additionally drawn as diamonds. The vertical, short-dashed line and the second isochrone (AKs, cut = 2.89 mag, long-dashed line) indicate the position of the blue and the red colour-cut (see Sect. 6). The tilted lines, equally spaced in H-band, are lines of reddening according to the extinction law of Nishiyama et al. (2009) and are the boundaries of the bins used to estimate the residual contamination of the member sample. The estimation was performed in two different ways for bins 1 to 3 (counted from bottom to top, solid lines) and for bins 4 to 6 (dashed lines). Right panel: ratio of the number of expected contaminating field stars in the member sample after proper motion selection and colour-cut to the number of cluster members for the respective mass bin (see right panel) plotted vs. the initial mass as determined from the 4 Myr Padova isochrone. The number of contaminating field stars for the first three bins (solid) and for the bins 4 to 6 (dashed) are estimated according to Appendix C.2 and Appendix C.1, respectively. |
| Open with DEXTER | |
Appendix C: Assessment of the remaining contaminants in the cluster sample
After the proper motion member selection and the additional colour-cut had been applied (see Sect. 6), 6 M, K supergiants remained in the cluster sample and could only be removed because their spectral type is known from the LHO catalogue. In order to study the influence of hidden field stars in the final cluster sample on the MF slope, their number was estimated in the mass range from 4.6 ≤ mPad,4Myr ≤ 40.0 M⊙. The minimum mass of 4.6 M⊙ corresponds to the minimum mass entering the mass function for the 4 Myr Padova isochrone, while the upper mass boundary at mPad,4 Myr = 40.0 M⊙ is chosen such that for all stars with higher masses the spectral type is known and the final cluster sample can be considered clean. This mass range was splitted in six mass bins with equal spacing in H-band (see left panel in Fig. B.1, tilted lines). About 70% of all cluster members residing within the three uppermost bins (bins 4 to 6 in Table C.1, mPad,4 Myr ≥ 18.0 M⊙) have a unique counterpart in the LHO spectral catalogue (see Fig. 9). The estimation of the number of contaminating field stars ncont among stars without a spectral classification within bin 4 to 6 can therefore be based on the known number of M, K giants in each bin (Appendix C.1). Due to the lack of spectral identifications in the mass range mPad,4Myr < 18.0 M⊙ this is not possible for the bins 1 to 3. The assessment of ncont within these bins relies on the ratio of the number of field stars which are removed due to their red colour to the number of field stars identified by their proper motions in the same colour-range (see Appendix C.2). The MF slope is then re-determined after randomly selecting and removing the estimated number of contaminants within each mass bin from the final cluster sample (Appendix C.3).
Estimated remaining contaminations in the cluster member sample after proper motion and colour selection.
C.1. Estimation of ncont for mPad,4Myr ≥ 18.0 M⊙
50 stars out of a total of 568 stars in the final cluster sample have a unique counterpart of spectral type O or B in the LHO catalogue. Further 13 stars can not be assigned unambiguously to early type sources in the spectral catalogue. The ambiguous assignments for these stars are caused by the higher resolution of the NACO datasets such that several stars in the final catalogue are the potential counterparts of one source in the LHO catalogue (these stars are marked by an X-cross in Fig. 9). For the bulk of cluster members within the high mass bins (4 to 6) the spectral types are known. The 6 M, K supergiants, which were excluded from the final cluster sample, are located in the same region of the CMD. Therefore, the estimation of the number of contaminants among the stars without known spectral type can be based on the ratio of the number of known M, K supergiants nM, K to the number of spectroscopically classified early type stars nST (ST stands for spectral type) in the respective bin.
For each of the bins 4 to 6 the numbers of stars in the final cluster sample with a unique (nST), an ambiguous (nambST) and without assignment (nnoST) to a source in the LHO catalogue are determined. The number of stars with an ambiguous assignment within each bin is distributed among nST and nnoST. For example two stars in bin 6 are potential counterparts for the WR-star with number 47 in the LHO catalogue. As only one of the two stars is the true counterpart, nST and nnoST are both increased by one. If the two stars would reside in two different bins, nST and nnoST would be each increased by 0.5 in both bins.
The number of hidden M, K supergiants (ncont,MK) among the stars of the final cluster sample without or with ambiguous spectral identification within the bins 4 to 6 is the ratio of the number of identified M, K giants (nM,K) in the respective bin (see left panel in Fig. B.1) to nST times nnoST:  (C.1)These numbers are stated in Table C.1.
C.2. Estimation of ncont for mPad,4Myr < 18.0 M⊙
For stars fainter than about H = 15.5 mag the cluster membership of a star in the final cluster sample could not be confirmed by its spectral identification in the LHO catalogue anymore (see Fig. 9) and the number of residual field stars hidden in the final cluster sample can only be estimated. The estimation of ncont for stars with mPad,4Myr < 18.0 M⊙ uses the field stars outside the colour-cuts (see Fig. B.1, black triangles), to assess the ratio of the number of field stars, which are removed from the cluster sample solely due to their colour, to the number of field stars, which are already identified because of their proper motions. The field stars removed by the blue and the red colour-cut (see Sect. 6) belong to different populations, though.
Stars with colours H − Ks ≤ 1.3 are likely main sequence foreground stars located in the Galactic spiral arms. As these stars are co-moving with the disc with ~200 km s-1 and hence posses similar proper motions as the cluster, it is not possible to discriminate these stars based on their proper motion alone. However, they are very effectively removed by the blue colour-cut, as their colours due to their smaller distance and, therefore, lower extinction differ from the colour of stars in the inner bulge. In fact, for the mass bins 1 and 2 the number of presumed foreground stars, which are rejected because of their blue colour, is equal to or exceeds the number of blue proper motion non-members by a factor of five. At least for the lowermost mass bin cluster and foreground stars are more effectively discerned based on their colours than on their proper motions, which significantly increases the estimated number of contaminants for the respective mass bins. But because of the distinct colour ranges of stars in the final cluster sample and blue foreground stars from the spiral arms in the mass range used for the PDMF derivation (see Fig. 8), a significant contribution of foreground stars to the residual contamination of the final cluster sample is not expected. Therefore stars left of the blue colour-cut are not used to estimate the remaining contamination, as this would overestimate the number of contaminants.
Otherwise, the bulk of stars located in the Galactic bulge experience a similar or larger extinction as the cluster (see right panel in Fig. 8). Bulge stars, which due to their large number constitute the dominant source of contaminants for lines of sight towards the GC, are hence harder to discern from the cluster by their colour, but because of their randomized motion and systematically lower velocities (see Fig. 3 in Rich et al. 2007) they are more easily removed by the proper motion membership criterion.
To estimate the number of residual contaminants in the cluster sample for bins 1 to 3 we therefore use the red sources in the field star CMD. Within each of the mass bins 1 to 3, the number of field stars removed based on the red colour-cut (nf,red,cc) is divided by the number of field stars in the same colour-range identified by their proper motion (nf,red,pm). This ratio is then multiplied with the number of field stars between the red and blue colour-cut in that mass bin (nf,within cc) to retrieve the expected number of contaminating field stars in the cluster sample: 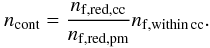 (C.2)The estimated numbers of contaminants ncont within the three mass bins are stated in Table C.1 (bin number 1 to 3).
The ratio of ncont to the number of cluster members nm (including the 6 known M, K supergiants) is drawn in Fig. B.1 (right panel) for all mass bins (solid for bins 1 to 3, dashed for bins 4 to 6). As for bins 1 to 3 ncont refers to the total number of contaminants after proper motion and colour-selection, the number of identified M, K supergiants nM,K is added to the estimated number of hidden field stars ncont for the bins 4 to 6. The error bars follow from error propagation assuming Poisson errors for the number of identified M, K supergiants and cluster members in each mass bin. The ratios ncont/nm are consistent for all mass bins within the uncertainties, with an expected average residual contamination of ⟨ ncont/nm ⟩ = 14 ± 5%.
As explained above we expect to overestimate ncont if stars left of the blue colour-cut are as well taken into account for the derivation of ncont, but we state the retrieved values for completeness. The usage of red and blue sources leads to considerably larger values of ncont for the mass bins 1 and 2, yielding 25.1 ± 10.4 and 9.8 ± 4.3 , respectively (see Table C.1 for comparison). The ratio ncont/nm for these two bins is raised to 0.23 ± 0.10 (bin 1) and 0.21 ± 0.10 (bin 2), which slightly increases the average residual contamination: ⟨ ncont/nm ⟩ = 16 ± 5%.
C.3. Influence of hidden field stars on the mass function slope
The influence of the contaminants on the mass function slope was studied for the mass function derived for the 4 Myr Padova isochrone. Within each mass bin, ncont stars, with ncont being the estimated number of contaminants in the respective mass bin, were randomly selected and removed from the final cluster sample. For the bins 4 to 6 only stars without spectral identification were selected and removed, whereas at least one star of each LHO number occurring in the full final cluster sample remained in the cluster sample. The mass function was then derived in the same way as for the full sample (see Sect. 8) using equal number bins (Method A).
To account for the error of ncont, the removed number of contaminants in each bin was independently varied between the three values ncont − Δncont, ncont and ncont + Δncont. For each combination of the removed number of contaminants per bin the random selection and removal of stars was repeated 100 times. The retrieved mass functions slopes α vary in the range between − 1.74 and − 1.50. The mean value of all derived slopes is − 1.63, which is the same slope as derived using the best value of ncont for all bins. In general the mass function slope flattens for a larger total number of removed stars, as the number of estimated contaminants (and the respective errors) increases towards lower masses. The steepest slopes are naturally derived for combinations where the ratio of the number of stars removed in bins 1 to 3 to the number of stars removed in bin 4 to 6 is largest. The steepest retrieved slope of − 1.74 ± 0.09 is still well contained within the errors of the MF slope for the 4 Myr Padova isochrone derived without accounting for residual field stars (α = −1.68 ± 0.09). On the other hand, the flattest slope − 1.50 ± 0.09 is considerably flatter, although the ranges of the formal fitting errors still marginally overlap. The mass function slopes reported in Table 5 can therefore (within the uncertainties) be regarded as lower (steep) limits for the true PDMF slope of the Quintuplet cluster.
If stars left of the blue colour-cut are considered during the estimation of ncont (see last paragraph of Appendix C.2), the
number of stars to be removed from the two lowest mass bins (bin 1 and 2) is significantly increased. The retrieved PDMF slopes are therefore flatter, ranging from α = −1.71 to −1.39 with an average value of α = −1.55 (compared to αmin = −1.74, αmax = −1.50 and a mean value of α = −1.63).
© ESO, 2012
Current usage metrics show cumulative count of Article Views (full-text article views including HTML views, PDF and ePub downloads, according to the available data) and Abstracts Views on Vision4Press platform.
Data correspond to usage on the plateform after 2015. The current usage metrics is available 48-96 hours after online publication and is updated daily on week days.
Initial download of the metrics may take a while.