| Issue |
A&A
Volume 540, April 2012
|
|
|---|---|---|
| Article Number | A45 | |
| Number of page(s) | 26 | |
| Section | Extragalactic astronomy | |
| DOI | https://doi.org/10.1051/0004-6361/201116674 | |
| Published online | 23 March 2012 | |
Online material
Appendix A: Photometric redshifts: accuracy and reliability
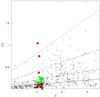 |
Fig. A.1
Distribution of the 68% range of the photo-z solutions (Δz) as a function of the associated best-fit photo-z for the 436 GROND sources identified as galaxies (empty circles). Candidate members of XMMU J0338.7 + 0030 are reproduced with red (green) filled circles if they are within (outside) the bona fide cluster region; the three spectroscopic members among them are marked with blue filled circles (see Sect. 3.3.2). The dotted, short-dashed, long-dashed and solid lines represent values of Δz equal to 0.4, 0.2, 0.1 and 0.05 × (1 + z), respectively. |
| Open with DEXTER | |
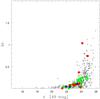 |
Fig. A.2
Distribution of Δz as a function of the z′-band magnitude for the same GROND sources displayed in Fig. A.1. Symbols have the same meaning as well. |
| Open with DEXTER | |
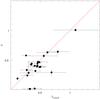 |
Fig. A.3
Comparison of photometric redshifts for the 24 galaxies that are in common between our GROND photometric catalogue and the SDSS DR7 one (Sect. 2.4.1). For the SDSS photo-z’s, uncertainties correspond to ± 1σ values. The red line represents equality. |
| Open with DEXTER | |
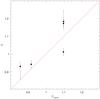 |
Fig. A.4
Comparison of photometric and spectroscopic redshifts for the five sources in the GROND photometric catalogue observed with FORS2 (Sect. 2.4.1). For each spectroscopic value, we show the 68% range of the photometric estimates. The red line represents equality. |
| Open with DEXTER | |
Here we discuss the accuracy of the photometric estimates of the distances to the individual sources in the 3.9 × 4.3 arcmin2 region of XMMU J0338.7 + 0030 imaged with GROND that is achieved through the GROND multi-band photometry and the photo-z code le Phare (see Sect. 3.2). At variance with works on survey areas/deep fields, we do so on the basis of photometric redshifts, mostly, because spectroscopic ones are available for only 0.6% of the GROND photometric sample (Sect. 2.4.1).
In particular, we reproduce the behaviour of the 68% range of the photo-z solutions yielded by le Phare, Δz16, as a function of the best-fit photo-z or z′-band magnitude for the 436 sources out of 832 that are classified as galaxies by the best-fit solution (Figs. A.1 and A.2, respectively). The CFHTLS galaxy templates without emission lines are used. The 42 galaxies selected as fiducial cluster members (i.e., with 1.01 ≤ z ≤ 1.23, see Sect. 3.3.1) are colour-coded as in Fig. 15 (Sect. 3.2.2).
Overall, the distribution of these photometric redshifts is well described by a straight line of equation Δz ~ 0.05 × (1 + z) up to z ~ 1.5; only 2 photo-z estimates (i.e., 0.4%) behave as outliers, in the sense that they exhibit a value of Δz > 0.4 × (1 + z). Unsurprisingly, photometric redshifts lower than 1 are assigned with an accuracy that is better than Δz ~ 0.05 × (1 + z), whereas photometric redshifts between 1.5 and 3 exhibit a mean accuracy equal to Δz ~ 0.1 × (1 + z) but with a large scatter. In addition, an accuracy of 0.2 or better characterizes the photometric redshifts attributed to galaxies that are brighter than z′ ~ 23.5, which corresponds to a 10σ detection (see Sect. 2.3.2).
The candidate member galaxies of XMMU J0338.7 + 0030 tend to exhibit the lowest values of Δz among the galaxies with the same z′-band magnitude (Fig. A.2). However, three fiducial members within a cluster-centric distance of 1′ exhibit values of Δz between 0.3 and 1.1: one is an outlier (Fig. A.1).
As a consistency check of our set of photometric redshifts, we compared photo-z’s for 24 GROND sources with counterparts in the SDSS DR7 (see Sect. 2.3.2). The comparison SDSS photometric redshifts were calculated using a Neural Network method (Oyaizu et al. 2008). The agreement between these two independent sets of photo-z estimates is good up to z ~ 1. As expected, our values have significantly lower uncertainties since they are based on medium-deep photometry in the g′,r′,i′,z′,J,H,Ks bands (e.g., Bolzonella et al. 2000). However, the u-band photometry that is available from the SDSS shallower imaging in the u,g,r,i,z bands (Abazajian et al. 2009 and references therein) better helps constraining photo-z’s of galaxies at z ≤ 0.4 (Bolzonella et al. 2000).
Finally, we reproduce photometric redshifts vs. spectroscopic ones for the five extragalactic sources in the GROND photometric catalogue that were observed with VLT-FORS2 (see Sect. 2.4.1) in Fig. A.4. In spite of a slight tendency towards higher values, our photometric redshifts, computed without any training of the solutions of the photo-z code le Phare, agree with the spectroscopic ones within ± 0.1.
Appendix B: On the z′ – H vs. H colour − magnitude diagram of XMMU J0338.7+0030
Here we investigate the origin of the discrepancy between the spectroscopic redshift of XMMU J0338.7 + 0030 (z = 1.097 ± 0.002, Sect. 2.4.2) and the value that was suggested from the analysis of the z − H vs. H colour − magnitude diagram obtained from the CAHA imaging (z ~ 1.45 ± 0.15, Sect. 2.2.2). There total magnitudes correspond to Kron aperture magnitudes i.e., computed as SExtractor MAG_AUTO (Sect. 2.1.2).
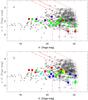 |
Fig. B.1
z′ − H vs. H colour − magnitude diagram for all GROND sources in the XMMU J0338.7 + 0030 region with flux detections in the z′,H bands at a significance level ≥ 1σ, whatever the classification of the source by Le Phare (i.e., stars are included). Photometric errors (1σ) are also shown. As in Fig. 15, candidate members of XMMU J0338.7 + 0030 are reproduced with red (green) filled circles (squares) if they are within (outside) the bona fide cluster region (panel a)). The three spectroscopic cluster members in the GROND photometric catalogue are marked with blue filled circles there. Green asterisks represent the two QSO at a cluster-centric distance greater than 1′. Alternatively (panel b)), photometric cluster members classified as galaxies are colour-coded according to their spectro-photometric type, which is E (red), Sbc (yellow), Scd (green), Im (cyan) or SB (blue). In each panel, the red short-dashed, solid and long-dashed lines represent the 1σ, 3σ, and 5σ flux thresholds in the z′,H bands (cf. Sect. 2.3.2). Photometric members classified as elliptical galaxies define a narrow red locus in this colour − magnitude diagram. |
| Open with DEXTER | |
Figure B.1 shows the z′ − H vs. H colour − magnitude diagram of the same cluster obtained from the GROND simultaneous multi-band imaging, where total magnitudes are computed following method B (see Sect. 2.3.2). Its comparison with the analogous diagram in Fig. 3 (Sect. 2.2.2) reveals that the spectroscopic members with ID = 2 and ID = 16 exhibit z′ − H colours that are about 0.8 Vega mag and 0.6 Vega mag bluer than their z − H colours listed in Table 1 (Sect. 2.2.2). Therefore, they lie closer to the spectroscopic member with ID = 15 (with z′ − H = 2.24 Vega mag, in full agreement with its z − H colour listed in Table 1) in Fig. B.1 than in Fig. 3. In addition, the existence of a red sequence is suggested in Fig. B.1. If we compute total magnitudes following method A, the spectroscopic members with ID = 2 and ID = 16 exhibit z′ − H colours that are about 0.4 Vega mag bluer than their z − H colours in both cases, whereas the spectroscopic member with ID = 15 exhibits a z′ − H colour that is about 0.3 Vega mag redder than its z − H colour this time. The H-band magnitudes of these three galaxies can differ by up to ± 0.5 Vega mag with respect to those listed in Table 1, as a function of object and method (A or B).
The method adopted to compute total magnitudes certainly impacts the estimated brightness of sources like these three galaxies, which are at the limit between being considered partly resolved or point-like for resolutions of 1.1 − 1.3′′. However, it is likely the stacking of individual frames without PSF-matching in the case of the OMEGA2000 images that explains the previous differences in colours.
We note that an SSP model with Salpeter IMF and solar metallicity exhibits z − H ~ 2.4 Vega mag when observed at z = 1.1, for a formation redshift between 3 and 10 (Fig. 3 in Fassbender et al. 2011c). This colour is about 0.8 Vega mag bluer than the z − H colour of the same model observed at z = 1.45 (Fig. 3). It also agrees well with the distribution of the spectro-photometrically classified elliptical galaxies in Fig. B.1, modulo (small) transformations between different z,H filters. At the same time, it is not inconsistent with the distribution of the spectroscopic members with absent/weak [OII] line emission (ID = 2 and ID = 15) in Fig. 3, taking into account the photometric uncertainties.
© ESO, 2012
Current usage metrics show cumulative count of Article Views (full-text article views including HTML views, PDF and ePub downloads, according to the available data) and Abstracts Views on Vision4Press platform.
Data correspond to usage on the plateform after 2015. The current usage metrics is available 48-96 hours after online publication and is updated daily on week days.
Initial download of the metrics may take a while.