Fig. B.1
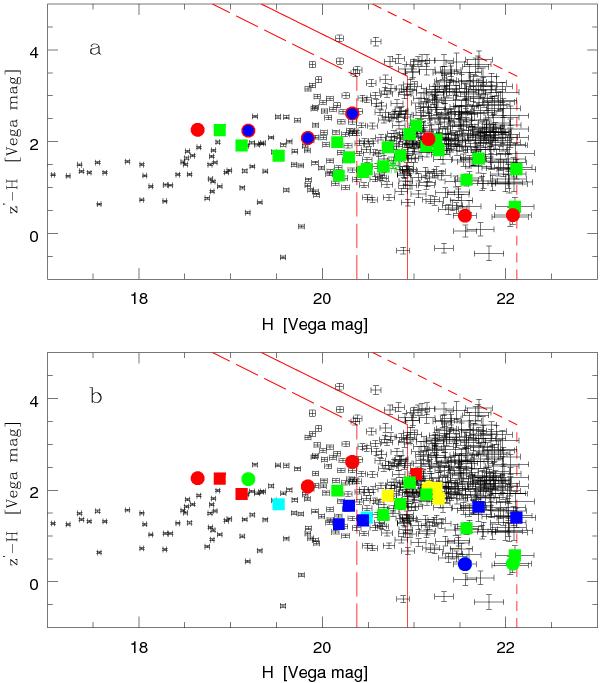
z′ − H vs. H colour − magnitude diagram for all GROND sources in the XMMU J0338.7 + 0030 region with flux detections in the z′,H bands at a significance level ≥ 1σ, whatever the classification of the source by Le Phare (i.e., stars are included). Photometric errors (1σ) are also shown. As in Fig. 15, candidate members of XMMU J0338.7 + 0030 are reproduced with red (green) filled circles (squares) if they are within (outside) the bona fide cluster region (panel a)). The three spectroscopic cluster members in the GROND photometric catalogue are marked with blue filled circles there. Green asterisks represent the two QSO at a cluster-centric distance greater than 1′. Alternatively (panel b)), photometric cluster members classified as galaxies are colour-coded according to their spectro-photometric type, which is E (red), Sbc (yellow), Scd (green), Im (cyan) or SB (blue). In each panel, the red short-dashed, solid and long-dashed lines represent the 1σ, 3σ, and 5σ flux thresholds in the z′,H bands (cf. Sect. 2.3.2). Photometric members classified as elliptical galaxies define a narrow red locus in this colour − magnitude diagram.
Current usage metrics show cumulative count of Article Views (full-text article views including HTML views, PDF and ePub downloads, according to the available data) and Abstracts Views on Vision4Press platform.
Data correspond to usage on the plateform after 2015. The current usage metrics is available 48-96 hours after online publication and is updated daily on week days.
Initial download of the metrics may take a while.