| Issue |
A&A
Volume 539, March 2012
|
|
|---|---|---|
| Article Number | A106 | |
| Number of page(s) | 17 | |
| Section | Extragalactic astronomy | |
| DOI | https://doi.org/10.1051/0004-6361/201118172 | |
| Published online | 01 March 2012 | |
Online material
List of our observed compact groups, group coordinates, number of member galaxies, average redshift, and our group classification as described in the text.
Group dynamical properties.
Appendix A
We present here a set of figures representative of class A, class B groups.
 |
Fig. A.1
Stacked R band acquisition images for a sample of class A confirmed compact groups. From top left to bottom right, in increasing right ascension order: PCG001108+054449, PCG015254-001033, PCG102512+091835, PCG114233+140738, PCG151833-013726, and PCG235439+032308. The black lines visible in some images are the gap between the two CCDs on the EMMI red mosaic. In all cases the whole group was in one chip, but imaged at different rotation angles, to position accurately the slit. Exposure times vary from 180 s to 450 s. In all images N is up and E is left. |
| Open with DEXTER | |
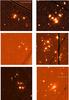 |
Fig. A.2
Same for Fig. 8, but for class B groups. From top left to bottom right, in increasing right ascension order: PCG031139+072404, PCG091524+213038, PCG105400+113327, PCG111250+132815, PCG151037+061618, and PCG234100+000450. |
| Open with DEXTER | |
© ESO, 2012
Current usage metrics show cumulative count of Article Views (full-text article views including HTML views, PDF and ePub downloads, according to the available data) and Abstracts Views on Vision4Press platform.
Data correspond to usage on the plateform after 2015. The current usage metrics is available 48-96 hours after online publication and is updated daily on week days.
Initial download of the metrics may take a while.