| Issue |
A&A
Volume 539, March 2012
|
|
|---|---|---|
| Article Number | A116 | |
| Number of page(s) | 19 | |
| Section | Interstellar and circumstellar matter | |
| DOI | https://doi.org/10.1051/0004-6361/201118061 | |
| Published online | 02 March 2012 | |
Online material
Appendix B: Clump properties and individual velocity channel maps
In this appendix we present full versions of Tables 1 and 3 and individual velocity channel maps together with maps showing identified clumps (see Figs. B.1–B.5).
13CO(J = 2–1) clump properties – lower region.
13CO(J = 2–1) clump properties – upper region.
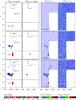 |
Fig. B.1
Clumps identified in the lower region (left two panels) and corresponding brightness temperature (right two panels) in the first three velocity channels. Filled regions show clumps 1–18, dotted regions show clumps 19–35. Colors of clumps correspond to colors of dendrogram leaves in Fig. 2. |
| Open with DEXTER | |
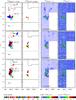 |
Fig. B.2
Clumps identified in the lower region (left two panels) and corresponding brightness temperature (right two panels) in the second three velocity channels. Filled regions show clumps 1–18, dotted regions show clumps 19–35. Colors of clumps correspond to colors of dendrogram leaves in Fig. 2. |
| Open with DEXTER | |
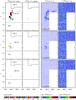 |
Fig. B.3
Clumps identified in the lower region (left two panels) and corresponding brightness temperature (right two panels) in the last three velocity channels. Filled regions show clumps 1–18, dotted regions show clumps 19–35. Colors of clumps correspond to colors of dendrogram leaves in Fig. 2. |
| Open with DEXTER | |
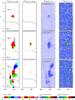 |
Fig. B.4
Clumps identified in the upper region (left two panels) and corresponding brightness temperature (right two panels) in the first three velocity channels. Colors of clumps correspond to colors of dendrogram leaves in Fig. 3. |
| Open with DEXTER | |
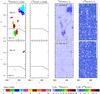 |
Fig. B.5
Clumps identified in the upper region (left two panels) and corresponding brightness temperature (right two panels) in the last two velocity channels. Colors of clumps correspond to colors of dendrogram leaves in Fig. 3. |
| Open with DEXTER | |
© ESO, 2012
Current usage metrics show cumulative count of Article Views (full-text article views including HTML views, PDF and ePub downloads, according to the available data) and Abstracts Views on Vision4Press platform.
Data correspond to usage on the plateform after 2015. The current usage metrics is available 48-96 hours after online publication and is updated daily on week days.
Initial download of the metrics may take a while.