| Issue |
A&A
Volume 539, March 2012
|
|
|---|---|---|
| Article Number | A48 | |
| Number of page(s) | 41 | |
| Section | Extragalactic astronomy | |
| DOI | https://doi.org/10.1051/0004-6361/201117562 | |
| Published online | 23 February 2012 | |
Online material
Main properties of the sample of 195 Type 1 AGN analysed in this work.
Appendix A
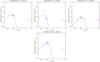
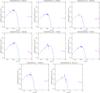
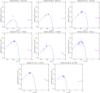
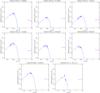
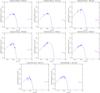
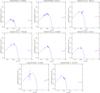
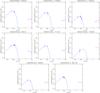
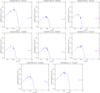
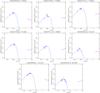
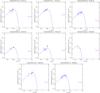
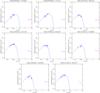
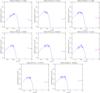
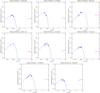
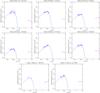
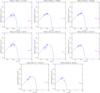
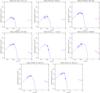
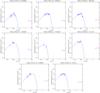
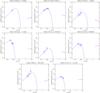
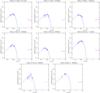
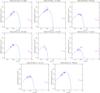
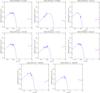
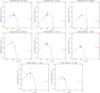
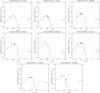
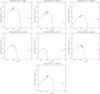
We present here the optical-UV-X-ray SEDs obtained applying the correction discussed in Sect. 3.2, for all the 195 sources analysed in this paper. The filled blue squares represent the fluxes in the GALEX NUV/FUV bands, while the empty squares represent the optical data. The upper limits on the NUV/FUV fluxes are represented as downward arrays. The fit has been done using the model quoted in Sect. 3.4 (blue curve). We also show the slope of the best-fit model in the rest-frame energy range 1–10 keV (magenta curve) obtained from the X-ray spectral analysis (for further details see Corral et al. 2011). The dashed magenta lines represent the errors on the best-fit model of the X-ray data, given by the errors on the spectral index Γ.

© ESO, 2012
Current usage metrics show cumulative count of Article Views (full-text article views including HTML views, PDF and ePub downloads, according to the available data) and Abstracts Views on Vision4Press platform.
Data correspond to usage on the plateform after 2015. The current usage metrics is available 48-96 hours after online publication and is updated daily on week days.
Initial download of the metrics may take a while.