| Issue |
A&A
Volume 536, December 2011
|
|
|---|---|---|
| Article Number | A57 | |
| Number of page(s) | 16 | |
| Section | Planets and planetary systems | |
| DOI | https://doi.org/10.1051/0004-6361/201014862 | |
| Published online | 07 December 2011 | |
Online material
Appendix B: Complementary tables and figures
Figure B.1 is similar to Fig. 3, but now extended to 100 Myr. We note that the general behaviour of the elements after 5 or 10 Myr is almost unchanged.
Table B.1 refers to the non-successful case, that is, at least one of the current regular satellite is lost during migration. In the table of this Appendix, when a given satellite experiences a collision with another satellite, in the column of the given satellite we indicate this with M, A, U, T, O, and si (the name of the participant of the collision). On the other hand, if the participant is a planetesimal, we indicate it with m/d, where m is the mass ( × 10-9 M⊙) and d is the diameter (in km) of the planetesimal.
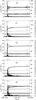 |
Fig. B.1
Similar to Fig. 3 but time extended to 100 Myr. Here we also show the evolution of the perihelion (q) and aphelion (Q) of the planets during migration. |
| Open with DEXTER | |
© ESO, 2011
Current usage metrics show cumulative count of Article Views (full-text article views including HTML views, PDF and ePub downloads, according to the available data) and Abstracts Views on Vision4Press platform.
Data correspond to usage on the plateform after 2015. The current usage metrics is available 48-96 hours after online publication and is updated daily on week days.
Initial download of the metrics may take a while.