| Issue |
A&A
Volume 532, August 2011
|
|
|---|---|---|
| Article Number | A29 | |
| Number of page(s) | 29 | |
| Section | Extragalactic astronomy | |
| DOI | https://doi.org/10.1051/0004-6361/201016136 | |
| Published online | 18 July 2011 | |
Online material
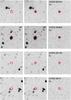 |
Fig. 6
R-band image cutouts for the supernova candidates SVISS-SN309, SVISS-SN402, SVISS-SN135 and SVISS-SN14. See Fig. 5 for descriptions on the different panels and marks. The most likely redshifts (from the typing code) for these SNe are (starting at the top) 0.47, 0.22, 0.98 and 0.36, respectively. |
| Open with DEXTER | |
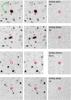 |
Fig. 7
R-band image cutouts for the supernova candidates SVISS-SN51, SVISS-SN54, SVISS-SN261 and SVISS-SN55. See Fig. 5 for descriptions on the different panels and marks. The most likely redshifts (from the typing code) for these SNe are (starting at the top) 0.51, 0.77, 0.37 and 0.83, respectively. |
| Open with DEXTER | |
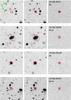 |
Fig. 8
R-band image cutouts for the supernova candidates SVISS-SN31, SVISS-SN56, SVISS-SN357 and SVISS-SN24. See Fig. 5 for descriptions on the different panels and marks. The most likely redshifts (from the typing code) for these SNe are (starting at the top) 0.12, 0.57, 1.4 and 0.81, respectively. Note that the host galaxy for SN357 is blended with a foreground galaxy, the selected host is the lowermost of the two galaxies. |
| Open with DEXTER | |
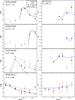 |
Fig. 10
Observed and fitted light curves for the supernova candidates SVISS-SN309, SVISS-SN402, SVISS-SN135, and SVISS-SN14. See Fig. 9 for descriptions on the different panels and marks. |
| Open with DEXTER | |
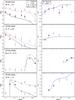 |
Fig. 11
Observed and fitted light curves for the supernova candidates SVISS-SN51, SVISS-SN54, SVISS-SN261, and SVISS-SN55. See Fig. 5 for descriptions on the different panels and marks. |
| Open with DEXTER | |
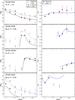 |
Fig. 12
Observed and fitted light curves for the supernova candidates SVISS-SN31, SVISS-SN56, SVISS-SN357, and SVISS-SN24. See Fig. 5 for descriptions on the different panels and marks. |
| Open with DEXTER | |
© ESO, 2011
Current usage metrics show cumulative count of Article Views (full-text article views including HTML views, PDF and ePub downloads, according to the available data) and Abstracts Views on Vision4Press platform.
Data correspond to usage on the plateform after 2015. The current usage metrics is available 48-96 hours after online publication and is updated daily on week days.
Initial download of the metrics may take a while.