| Issue |
A&A
Volume 532, August 2011
|
|
|---|---|---|
| Article Number | A107 | |
| Number of page(s) | 15 | |
| Section | Extragalactic astronomy | |
| DOI | https://doi.org/10.1051/0004-6361/201015654 | |
| Published online | 03 August 2011 | |
Online material
Appendix A: Using CalFUSE v3.2
Performing LyC measurements requires data acquired while working at the very limit of instrument sensitivity. We have therefore dedicated this appendix to a detailed analysis of the performance of the reduction pipeline on the Haro 11 data set. Haro 11 is one of several faint FUSE targets for which the CalFUSE background subtraction has resulted in negative flux at short wavelengths, and the results found here may be of interest to other similar investigations. We also approach the special case where the emission might originate from extended or off-center regions of the targets.
A.1. Haro 11, extended or point source?
This is a fundamental question when the reduction approach is to be decided. From the ACS/SBC UV image in Fig. 1, we see that the separation between the two strongest UV emitting regions is ~5″. In the header of the Haro 11 FUSE data, the keyword APER
 PA = 99.4, which means that the distance between the two regions are almost maximized in the cross-dispersion direction. The LWRS aperture of FUSE is 30″ × 30″. Only if the image height is roughly half the aperture size or more, will there be a significant effect on the height of the spectral image. Therefore, when only considering the far-UV ACS/SBC image, should Haro 11 pass as a point source. However, Fig. 1 covers a square 15″, and we know that star-forming regions do exist outside this from Fig. 2. In the Chandra image of Hayes et al. (see Hayes et al. 2007, Fig. 6) with the far-UV contours overplotted, the X-ray emission is seen at least out to a diameter of 25″.
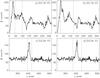 |
Fig. A.1
Part of the SiC 1B and SiC 2A IDFs seen in the cross-dispersion direction, summed over 920–950 Å. The extraction windows for the LWRS aperture is plotted in vertical hatched lines. The cross-dispersion centroids were determined with user select for the 1B files and target events only for the 2A files, and the width shows the maximum width in the wavelength interval. In a) SiC 1B reduced using the point source option, b) SiC 1B reduced using the extended source option, in c) SiC 2A reduced as point source, and d) SiC 2A reduced as extended source. The point source spectra have been corrected for astigmatism. Comparing a) and b), it is clear that the effect of that is significant in the SiC 1B spectrum. It is hard to determine whether the astigmatism correction has been made on the target data or on the slope of the background. The effect on the SiC 2A spectrum is not significant. The authors are not convinced that the flux from the target lies completely within the point source extraction windows for either 1B or 2A. The dips and peaks to the right of the extraction regions in 1B are artifacts of pipeline processing (Dixon 2007, priv. comm.). |
| Open with DEXTER | |
To check whether Haro 11 is consistent with a point source in the spectral image of the LWRS spectrum, we performed the following test. The astigmatic image height is smallest at 916 Å in the SiC 1B spectrum and at 926 Å in SiC 2A, that is, where we wish to measure the LyC. It is also close to reaching a minimum at Lyβ in the LiF 1A spectrum, where the continuum flux of Haro 11 is strong enough to perform the test. The airglow Lyβ fills the aperture, so if the Haro 11 continuum height is less than half of that it should pass as a point source. We find that the airglow Lyβ height is roughly 90 unbinned pixels, while the Haro 11 height just below and above Lyβ is half of that, 45 pixels. We conclude that Haro 11 is a borderline case for being considered as a point source, and in our analysis we therefore considered both cases.
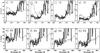 |
Fig. A.2
The plots show the extracted Haro 11 total signal (galaxy + background = WEIGHTS) for SiC 1B (upper row) and SiC 2A (lower row), over-plotted by the fitted background (BKGD) in dotted line. From left: a) and e) extended source setting, b) and f) point source setting with normal extraction, c) and g) point source setting with optimal extraction and WEIGHTS produced with background-subtraction routine turned off (BKGD imported from d) and h)), d) and h) point source setting with optimal extraction (corresponding to the treatment in Grimes et al. 2007). In theory c) should be identical to d), and g) identical to h), but they are not as discussed in the text. The spectra are rebinned by 16 pixels = 0.208 Å. Only night data are plotted. |
| Open with DEXTER | |
A.2. Producing the IDFs
Here, we reduced the Haro 11 data set with the last version of the pipeline, CalFUSE v3.2. The pipeline was run with both the point- and extended source options in order to compare the two methods. The processing trailer files were then scanned for warnings of which none were found. The IDFs and bad-pixel masks from the different exposures were coadded before the background fit and the extraction of the 1D spectra was made, all according to the recommended strategy for low S/N spectra in Dixon et al. (2007). The IDFs were then cross-correlated before they were combined (max correction 0.026 Å).
The cross-dispersion centroid The cross-dispersion centroids of the extraction windows were calculated using the cf
 edit routine with option target events only, except for the SiC 1A and SiC 1B where the contribution from the bright detector edge tends to move the centroids. For these two, the centroids were therefore determined with the option user select after careful inspection. This treatment turned out to be especially important for the point source reduction. In Fig. A.1, the SiC 1B and SiC 2A IDFs were summed in the cross-dispersion direction over the wavelength region 920–950 Å. The extraction windows for the LWRS aperture are plotted as vertical hatched lines, with the width displaying the maximum width within the wavelength interval. In a) and c) where the point source option has been used, part of the signal appears to fall outside the aperture.
Weights and off-center emission In Iwata et al. (2009), LyC imaging was performed for a sample of z ≃ 3.1 galaxies. It was found that the ionizing radiation in several cases was emitted from regions off-center from the non-ionizing emission. Looking at Haro 11, this possibility cannot be neglected since star-forming regions are also known to exist outside the HST/ACS far-UV image (see Sect. 2), and the scenario would likely be applicable to other FUSE galaxies as well. The point source option that utilizes the optimal extraction as standard routine must therefore be considered carefully when measuring possible LyC emission, not only because of the more narrow extraction window. This routine also extracts the 1D spectrum using weights, where the central pixels in the extraction window receive larger weight than the ones closer to the edges. The extended source option on the other hand, is not as sensitive to the way in which the centroid is chosen, and the 1D extraction routine is not applied using weights.
Astigmatism corrections When using the point source option, the data are corrected for astigmatism in the optical design. The model for this correction is based on a true point source, and its applicability must be questioned when considering the possibility that LyC leakage might originate from off-center regions. The astigmatism correction is performed on the location of the brightest pixels in the aperture, disregarding the centroid of the extraction region. If the emission from different wavelength bands originates from different spatial locations in the aperture, this will likely be done incorrectly for some of them (Sahnow 2010, priv. commun.). In Fig. A.1, the danger of performing the astigmatism correction on the slope of the detector background in SiC 1B is demonstrated. It is unclear whether the shape of what appears to be the target signal in a) is caused by a correction to either the target signal or the slope of the background. The SiC 2A signal on the other hand, does not seem to be affected in the same way.
We need to consider that the LyC could be emitted from an off-center star-forming region, the uncertainty of the astigmatism correction, and the risk that not all the signal falls within the point source extraction window, hence we need to consider both cases (point source and extended source) in our analysis.
A.3. From 2D to 1D
In the analysis we also wished to investigate the reliability of the 1D extraction routine, and tried different options such as optimal- or normal extraction, and selecting or not the background subtraction routine. There are eight 1D spectrum files produced by CalFUSE, one for each spectrum. These provide several options for the user to display the data, where for example FLUX, COUNTS, WEIGHTS, and BKGD (background) are offered. The WEIGHTS column represents the raw counts in COUNTS corrected for dead-time effects, but for faint targets such as Haro 11 the dead-time correction is negligible, so the two are essentially identical. The final flux is calculated by subtracting BKGD from WEIGHTS.
The data were reduced with different parameter set-ups. First we used the extended source setting (the default used in Bergvall et al. 2006). This can be seen in Fig A.2a, where the total SiC 1B signal (WEIGHTS) is overplotted with the fitted background (BKGD, dotted line). A clear overestimate of the background is visible at the shorter wavelengths. The same is plotted for SiC 2A in panel e). Dixon et al. (2007) argue for using the point source setting whenever possible in order to improve the background model for faint targets. We tried this both with normal extraction (all pixels get equal weight) as well as with the standard optimal extraction routine where central pixels get more weight (the latter being the case used in Grimes et al. (2007)). The resulting SiC 1B spectra can be seen in Fig. A.2b–d for 1B and f)–h) for 2A. In b) and f) the normal extraction produces a strong increase of the background at the shorter wavelengths. When the background is subtracted, this results not only in an unphysical negative flux, but also an artificially produced Ly-limit feature that makes it impossible to determine the zero-level of the flux below the Milky Way Ly-limit (912 Å). In c), d) and g)–h) the point source setting was used with the optimal extraction routine. The difference between them is that in c) and g) the WEIGHTS column is taken from a file where the background routine was turned off. The overplotted backgrounds are instead taken from the files in d) and h). The WEIGHTS columns should be identical regardless of whether the background has been subtracted or not, thus plot c) is expected to be identical to d), and g) identical to h), which they clearly are not. The reason for this is not known but could possibly, according to Dixon (2007, priv. commun.), be caused by the complex optimal extraction routine involving probability arrays used on low S/N spectra.
Comparing Fig A.2 to Fig. 8, we see a large difference between the two background models in SiC 2A. In Fig. 8 where the background has been fitted directly on the detector, the curve is smooth. In Fig A.2 on the other hand, the shape of the template background file is seen to vary in a way often uncorrelated to the Haro 11 data. This demonstrates the danger of using non-simultaneous template background files, and for faint targets the effect can be severe. The features will have a large effect on the output flux for which the amplitude will vary in an unknown way over the spectrum. The effect is largest at the shortest wavelengths in all panels of Fig A.2.
Summary Appendix A: We can conclude that both the point source and extended source options must be considered for the Haro 11 data since there are benefits and risks with both. While the point source option might be unable to include all of the signal, might skew the weighting if the emission is off-center, and in the case of SiC 1B perform a questionable astigmatism correction, the extended source option, which is otherwise more stable, has been shown to include more of the background region and therefore increase the uncertainty in the background model. We have also shown that the non-simultaneous background templates used by CalFUSE v3.2 display features that are uncorrelated to the Haro 11 data, and that these features can cause large errors in the final flux at random places over the spectrum (but especially at the shortest wavelengths). This analysis has therefore led us to develop our own background model from a direct fit to the detector response (Sect. 3.2), which is the standard procedure when reducing astronomical data.
© ESO, 2011
Current usage metrics show cumulative count of Article Views (full-text article views including HTML views, PDF and ePub downloads, according to the available data) and Abstracts Views on Vision4Press platform.
Data correspond to usage on the plateform after 2015. The current usage metrics is available 48-96 hours after online publication and is updated daily on week days.
Initial download of the metrics may take a while.