Fig. A.1
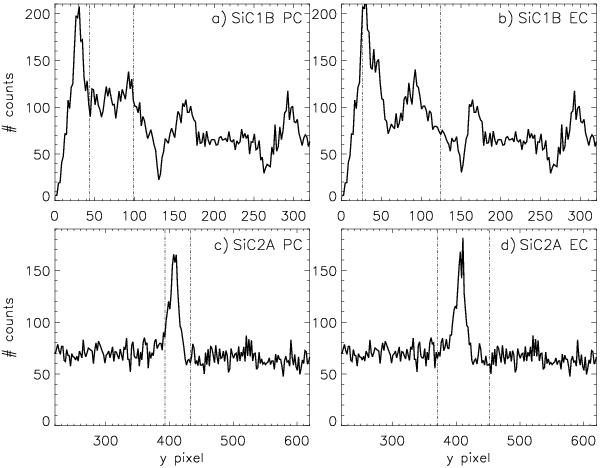
Part of the SiC 1B and SiC 2A IDFs seen in the cross-dispersion direction, summed over 920–950 Å. The extraction windows for the LWRS aperture is plotted in vertical hatched lines. The cross-dispersion centroids were determined with user select for the 1B files and target events only for the 2A files, and the width shows the maximum width in the wavelength interval. In a) SiC 1B reduced using the point source option, b) SiC 1B reduced using the extended source option, in c) SiC 2A reduced as point source, and d) SiC 2A reduced as extended source. The point source spectra have been corrected for astigmatism. Comparing a) and b), it is clear that the effect of that is significant in the SiC 1B spectrum. It is hard to determine whether the astigmatism correction has been made on the target data or on the slope of the background. The effect on the SiC 2A spectrum is not significant. The authors are not convinced that the flux from the target lies completely within the point source extraction windows for either 1B or 2A. The dips and peaks to the right of the extraction regions in 1B are artifacts of pipeline processing (Dixon 2007, priv. comm.).
Current usage metrics show cumulative count of Article Views (full-text article views including HTML views, PDF and ePub downloads, according to the available data) and Abstracts Views on Vision4Press platform.
Data correspond to usage on the plateform after 2015. The current usage metrics is available 48-96 hours after online publication and is updated daily on week days.
Initial download of the metrics may take a while.