| Issue |
A&A
Volume 531, July 2011
|
|
|---|---|---|
| Article Number | A148 | |
| Number of page(s) | 15 | |
| Section | Interstellar and circumstellar matter | |
| DOI | https://doi.org/10.1051/0004-6361/201015964 | |
| Published online | 04 July 2011 | |
Online material
Appendix A: The PolCor instrument
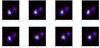 |
Fig. A.1
Eight images taken at an interval of 0.1 s in good seeing conditions. The plus sign denotes the position of the brighter star for the average image of 1500 exposers. The image motion is quite noticeable also during good conditions. |
| Open with DEXTER | |
The main reason for the construction of PolCor was the need for an instrument that can measure faint scattered light close to bright stars. The instrument is optimized for both scattered light from circumstellar dust particles as well as resonance line scattering from circumstellar gas in the following ways. To increase the contrast between the PSF wings and polarized scattered light from the dust, the instrument includes a polarizing mode. To further bring down the surface brightness of the wings of the stellar PSF (Point Spread Function) and avoid saturation of the central star, a coronographic optical design was chosen. In addition, to cancel out the diffraction cross of the PSF, a Lyot stop blocks the image of the support blades of the secondary mirror. In order to optimize the contrast ratio in the detection of resonance line scattering, the instrument is equipped with ultra-narrow band optical filters. Finally, to spatially resolve structures in the circumstellar environments, the instrument uses Lucky imaging (Sects. 3.2 and A.2), which considerably improves the sharpness of the images compared to the seeing limited case.
A.1. Technical details
The PolCor instrument is briefly described in the following points:
-
1.
The EMCCD (Electron Multiplying CCD) camera (AndorIXON) uses a thinned512 × 512 CCD array with 16 μm pixels, giving a full field-of-view of 1 arcminute. For low light levels it can be used in a photon counting mode, which is in principle noiseless. In practice this mode is limited by clock induced pulses, occurring typically once (per pixel) for 200 readouts. The sky emission is too bright for photon counting with broad band filters, and the normal mode of operation is the EM mode. Our laboratory measurements show that the EM mode is linear over a very wide brightness range (5 orders of magnitude!). In practice, all frames are stored so the mode of operation is a post-processing decision. The fastest full-frame readout rate is 33 Hz. Very high time resolution can be achieved by limiting the readout area of the chip, making speckle interferometry possible. The quantum efficiency is not particularly high (around 30%) in the UV, but this is probably because the anti-reflection coating is designed for longer wavelengths. The efficiency of the anti-reflection coating is high enough in the red spectral region that no interference fringes (caused by the OH sky emission) have been seen in the observations.
-
2.
A high-quality polarizer (Meadowlark Optics, DP-050-VIS) is placed in the converging beam from the telescope and can be rapidly turned to the four different positions: 0, 45, 90 and 135 degrees. At each position, typically 30 images with 0.1 s integration time are taken. One unit measurement cycle (which also includes a dark measurement with a closed shutter) takes approximately 20 s. It is repeated 100 times in order to compensate for changing sky conditions (seeing and transmission). The EMCCD has a frame transfer readout, which means that no time is lost due to readout. As a consequence, the overhead is limited to the time for turning the polarizer and the resulting overhead is 20% of the on target time.
-
3.
The coronographic masks, positioned in the focal plane of the telescope, consist of neutral density (ND) disks with three different sizes corresponding to 1
 5, 3″, and 6″ on the NOT. For each size, three different ND:s are available: ND = 2, 3.5 and 5, corresponding to damping factors of 100, 3300, and 105. The main reason for not using opaque disks is the need for an accurate centering of the star. This can be conveniently achieved when the star can be seen through the mask.
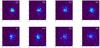
Fig. A.2 Same as Fig. A.1 but observed under poorer seeing conditions. Each image shows a pattern of more or less scattered speckles. The sharpness (measured as the percentage of the light that enters a box with sides = 0.55″) is indicated in the upper right corner of each image.
Open with DEXTER -
4.
The re-imaging optics are based on mirrors which provide a diffraction limited performance. To achieve the same image quality with lens optics, one would have to use several elements in both the collimator and the camera, making it hard to avoid disturbing ghost images due to multiple reflections. The reflectivity of the coatings (CVI Laser Corp.) of the four mirrors (two off-axis paraboloids and two flat folding mirrors) is better than 98.5% per surface over the whole sensitivity range of the detector, and thus the level of scattered light is kept low. The re-imaging optics have a 1:1 magnification (which is equivalent to a pixel scale of 0
12 at the NOT). Two Barlow lenses are available for 2 × and 3 × magnification (intended for speckle interferometry). -
5.
To avoid the diffraction cross from the secondary mirror support of the telescope, the Lyot stop blocks the re-imaged cross (with wider bars) as well as the secondary mirror (slightly oversized). Due to the Alt-Az construction of the NOT, the field de-rotator causes the diffraction cross to rotate and to compensate for that, the Lyot cross has a computer controlled de-rotator.
-
6.
Standard broad-band filters (Bessel U,B,V,R and I) are available as well as ultra-narrow band (≈ 1 Å) filters for the Ca II, Na I and K I resonance lines. For each of the resonance line filters, double-peaked reference filters are available. The filter holder flips quickly (≈ 1 s) between two positions, which allows for multiple filter exchanges during a measurement. This allows for accurate observations of line/continuum ratios also during less good photometric sky conditions.
A.2. PolCor data reduction and performance
As a first step in the data reduction, the image motion, defined by the centroid of the light distribution of a stellar image, is determined. Figure A.1 illustrates the image motion for a period of good seeing conditions. The images show two field stars. The star to the left is brighter than the star to the right. The eight images in Fig. A.1 are taken at an interval of 0.1 s and the plus sign denotes the position of the brighter star for the average image of 1500 exposers. Figure A.2 shows the equivalent observations during worse conditions. Even at good seeing conditions, the image motion is quite noticeable. In Fig. A.1, the speckles overlap, while in the period of poor seeing (Fig. A.2) they are more or less spread out. The image motion is typically a small fraction of an arcsecond on short time-scales. The image motion is further illustrated in Fig. A.3 (lower panel) where the relative center positions for 1500 frames (150 s) observed during good conditions are shown. A frame rate of 10 s-1 suffices to resolve the image motion (upper panel).
In order to quantify the spread-out due to the image motion, we calculate the sharpness of each image. The sharpness is measured as the percentage of light that enters a box with sides = 055 centered on the brightness peak. It varies on short time scales, in particular during periods of poor seeing (Figs. A.2 and A.4).
By correcting for the image motion, the resulting seeing is usually improved by 20–30%. By calculating the light concentration for each image and only including a fraction of them in the shift-and-add reduction step, the final image can be much sharper than that for traditional long integration imaging. It should also be noted that tracking errors of the telescope are easily compensated for in this shift-and-add reduction step. As a trade-off between sharpness and depth an acceptance level needs to be chosen, and shift-and-add procedure is then performed only for the accepted frames. In Fig. A.5 the effects of only shift-and-add and selecting 15% of the frames are shown.
The main purpose of PolCor is to measure faint scattered radiation close to bright stars and the level of diffracted and scattered light of the telescope/instrument combination should be as low as possible. In Fig. A.6, the PSF is shown for both the cases with and without an occulting disc.
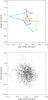 |
Fig. A.3
Upper panel: the image motion during 3 s. The time line is color coded to make it easier to follow. The used frame rate (10 s-1) clearly suffices to resolve the image motion. Lower panel: the center positions for a star during 150 s (1500 frames). |
| Open with DEXTER | |
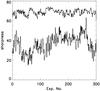 |
Fig. A.4
The sharpness of an image varies marginally during good seeing conditions (upper curve, corresponding to the example shown in Fig. A.1), and rapidly during poor seeing conditions (lower curve, corresponding to the example shown in Fig. A.2). The frame rate is 10 s-1 and the sharpness is measured as the percentage of the light that enters a box with sides = 0.55″. |
| Open with DEXTER | |
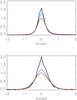 |
Fig. A.5
The seeing in images attained by simply averaging all the 1500 frames in the two examples observed under good (upper panel) and poor conditions (lower panel) is represented by the red curves. The FWHM is 0.7″ for the upper and 1.1″ for the lower curve. The blue curves show the results when only shifting and co-adding the frames. The black curves represent the seeing when only the sharpest 15% of the frames are used for the co-added image. The FWHM is 0.4″ for the upper case and 0.7″ for the lower, clearly demonstrating the improvement in spatial resolution. |
| Open with DEXTER | |
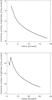 |
Fig. A.6
Upper panel: the radial cut of the PSF for PolCor without any occulting disc. The surface brightness is given as the fraction of the total intensity of the star per square arcsecond. Lower panel: the radial cut of the PSF is shown for the case when an occulting disc with a diameter of 6″ and attenuation of a factor 100 is used. |
| Open with DEXTER | |
© ESO, 2011
Current usage metrics show cumulative count of Article Views (full-text article views including HTML views, PDF and ePub downloads, according to the available data) and Abstracts Views on Vision4Press platform.
Data correspond to usage on the plateform after 2015. The current usage metrics is available 48-96 hours after online publication and is updated daily on week days.
Initial download of the metrics may take a while.