Free Access
Fig. A.2
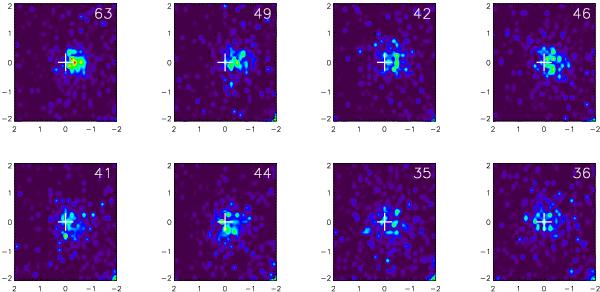
Same as Fig. A.1 but observed under poorer seeing conditions. Each image shows a pattern of more or less scattered speckles. The sharpness (measured as the percentage of the light that enters a box with sides = 0.55″) is indicated in the upper right corner of each image.
Current usage metrics show cumulative count of Article Views (full-text article views including HTML views, PDF and ePub downloads, according to the available data) and Abstracts Views on Vision4Press platform.
Data correspond to usage on the plateform after 2015. The current usage metrics is available 48-96 hours after online publication and is updated daily on week days.
Initial download of the metrics may take a while.