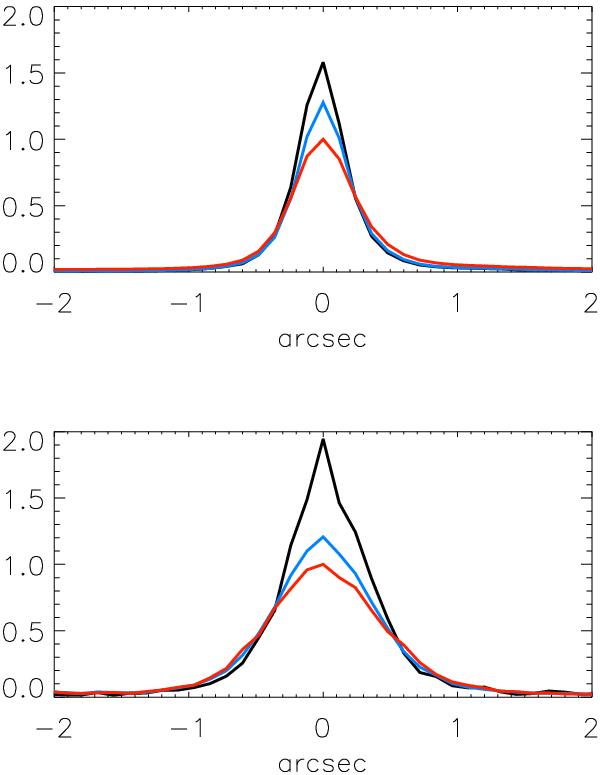
Fig. A.5

The seeing in images attained by simply averaging all the 1500 frames in the two examples observed under good (upper panel) and poor conditions (lower panel) is represented by the red curves. The FWHM is 0.7″ for the upper and 1.1″ for the lower curve. The blue curves show the results when only shifting and co-adding the frames. The black curves represent the seeing when only the sharpest 15% of the frames are used for the co-added image. The FWHM is 0.4″ for the upper case and 0.7″ for the lower, clearly demonstrating the improvement in spatial resolution.
Current usage metrics show cumulative count of Article Views (full-text article views including HTML views, PDF and ePub downloads, according to the available data) and Abstracts Views on Vision4Press platform.
Data correspond to usage on the plateform after 2015. The current usage metrics is available 48-96 hours after online publication and is updated daily on week days.
Initial download of the metrics may take a while.


