| Issue |
A&A
Volume 522, November 2010
|
|
|---|---|---|
| Article Number | A93 | |
| Number of page(s) | 43 | |
| Section | Planets and planetary systems | |
| DOI | https://doi.org/10.1051/0004-6361/200912340 | |
| Published online | 05 November 2010 | |
Online material
Dates, geometric and photometric data of the observations.
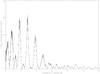 |
Fig. A.1
Lomb periodogram of 2003 FY128. |
| Open with DEXTER | |
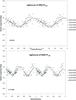 |
Fig. A.2
Rotational phase curve for 2003 FY128 obtained by using a spin period of 8.54 h (upper plot) and a spin period of 17.08 h (lower plot). The dash line is a Fourier Series fit of the photometric data. Different symbols correspond to different dates. |
| Open with DEXTER | |
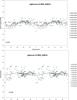 |
Fig. A.3
Rotational phase curves for 2003 MW12 obtained by using different spin periods; 5.9 h (upper plot) and 7.87 h (lower plot). In both case, we present a single peak lightcurve. The dash lines are a Fourier Series fits of the photometric data. Different symbols correspond to different dates. |
| Open with DEXTER | |
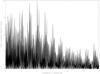 |
Fig. A.4
Lomb periodogram of 2003 MW12. |
| Open with DEXTER | |
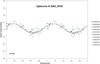 |
Fig. A.5
Rotational phase curve for 2003 OP32 obtained by using a spin period of 4.05 h. The dash line is a Fourier Series fit of the photometric data. Different symbols correspond to different dates. |
| Open with DEXTER | |
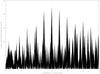 |
Fig. A.6
Lomb periodogram of 2003 OP32. |
| Open with DEXTER | |
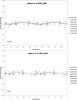 |
Fig. A.7
Rotational phase curves for 2004 SB60 obtained by using different spin periods: 6.09 h (upper plot) and 8.1 h (lower plot). In both cases, we present a single peak lightcurve. The dash lines are a Fourier Series fits of the photometric data. Different symbols correspond to different dates. |
| Open with DEXTER | |
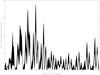 |
Fig. A.8
Lomb periodogram of 2004 SB60. |
| Open with DEXTER | |
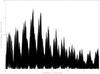 |
Fig. A.9
Lomb periodogram of 2005 CB79. |
| Open with DEXTER | |
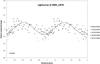 |
Fig. A.10
Rotational phase curve for 2005 CB79 obtained by using a spin period of 6.76 h. The dash line is a Fourier Series fit of the photometric data. Different symbols correspond to different dates. |
| Open with DEXTER | |
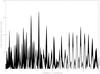 |
Fig. A.11
Lomb periodogram of 2005 RN43. |
| Open with DEXTER | |
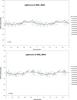 |
Fig. A.12
Rotational phase curves for 2005 RN43 obtained by using different spin periods: 5.62 h (upper plot) and 7.32 h (lower plot). In both case, we present a single peak lightcurve. The dash lines are a Fourier Series fits of the photometric data. Different symbols correspond to different dates. |
| Open with DEXTER | |
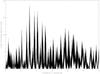 |
Fig. A.13
Lomb periodogram of 2005 RR43. |
| Open with DEXTER | |
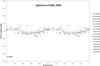 |
Fig. A.14
Rotational phase curve for 2005 RR43 obtained by using a spin period of 7.87 h. The dash line is a Fourier Series fit of the photometric data. Different symbols correspond to different dates. |
| Open with DEXTER | |
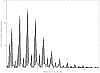 |
Fig. A.15
Lomb periodogram of Quaoar. |
| Open with DEXTER | |
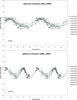 |
Fig. A.16
Rotational phase curve for Quaoar obtained by using a spin period of 8.84 h for the single peak lightcurve (upper plot) and a spin period of 17.68 h (lower plot) for the double lightcurve. The dash lines are a Fourier Series fit of the photometric data. Different symbols correspond to different dates. |
| Open with DEXTER | |
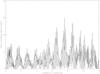 |
Fig. A.17
Lomb periodogram of Varuna. |
| Open with DEXTER | |
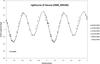 |
Fig. A.18
Rotational phase curve for Varuna obtained by using a spin period of 6.3418 h. The dash line is a Fourier Series fit of the photometric data. Different symbols correspond to different dates. |
| Open with DEXTER | |
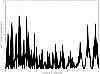 |
Fig. A.19
Lomb periodogram of 2002 AW197. |
| Open with DEXTER | |
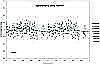 |
Fig. A.20
Rotational phase curve for 2002 AW197 obtained by using a spin period of 8.78 h. The dash line is a Fourier Series fit of the photometric data. Different symbols correspond to different dates. |
| Open with DEXTER | |
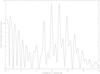 |
Fig. A.21
Lomb periodogram of 2002 TX300. |
| Open with DEXTER | |
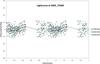 |
Fig. A.22
Rotational phase curve for 2002 TX300 obtained by using a spin period of 8.16 h. The dash line is a Fourier Series fit of the photometric data. Different symbols correspond to different dates. |
| Open with DEXTER | |
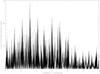 |
Fig. A.23
Lomb periodogram of Makemake. |
| Open with DEXTER | |
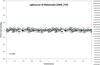 |
Fig. A.24
Rotational phase curve for Makemake obtained by using a spin period of 7.65 h. The thick line is a Fourier Series fit of the photometric data. Different symbols correspond to different dates. |
| Open with DEXTER | |
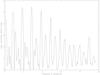 |
Fig. A.25
Lomb periodogram of 2001 YH140. |
| Open with DEXTER | |
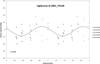 |
Fig. A.26
Rotational phase curve for 2001 YH140 obtained by using a spin period of 13.2 h. The dash line is a Fourier Series fit of the photometric data. Different symbols correspond to different dates. |
| Open with DEXTER | |
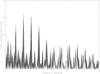 |
Fig. A.27
Lomb periodogram of Orcus. |
| Open with DEXTER | |
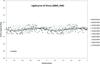 |
Fig. A.28
Rotational phase curve for Orcus obtained by using a spin period of 10.47 h. The dash line is a Fourier Series fit of the photometric data. Different symbols correspond to different dates. |
| Open with DEXTER | |
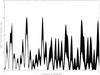 |
Fig. A.29
Lomb periodogram of 2002 VE95. |
| Open with DEXTER | |
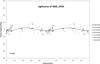 |
Fig. A.30
Rotational phase curve for 2002 VE95 obtained by using a spin period of 9.97 h. The dash line is a Fourier Series fit of the photometric data. Different symbols correspond to different dates. |
| Open with DEXTER | |
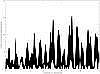 |
Fig. A.31
Lomb periodogram of 2003 AZ84. |
| Open with DEXTER | |
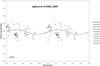 |
Fig. A.32
Rotational phase curve for 2003 AZ84 obtained by using a spin period of 6.79 h. The dash line is a Fourier Series fit of the photometric data. Different symbols correspond to different dates. |
| Open with DEXTER | |
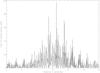 |
Fig. A.33
Lomb periodogram of 2003 VS2. |
| Open with DEXTER | |
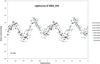 |
Fig. A.34
Rotational phase curve for 2003 VS2 obtained by using a spin period of 7.42 h. The dash line is a Fourier Series fit of the photometric data. Different symbols correspond to different dates. |
| Open with DEXTER | |
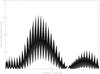 |
Fig. A.35
Lomb periodogram of 2004 UX10. |
| Open with DEXTER | |
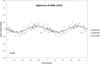 |
Fig. A.36
Rotational phase curve for 2004 UX10 obtained by using a spin period of 5.68 h. The dash line is a Fourier Series fit of the photometric data. Different symbols correspond to different dates. |
| Open with DEXTER | |
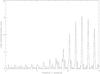 |
Fig. A.37
Lomb periodogram of Haumea. |
| Open with DEXTER | |
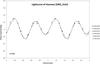 |
Fig. A.38
Rotational phase curve for Haumea obtained by using a spin period of 3.92 h. The dash line is a Fourier Series fit of the photometric data. Different symbols correspond to different dates. |
| Open with DEXTER | |
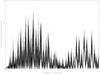 |
Fig. A.39
Lomb periodogram of 2005 RM43. |
| Open with DEXTER | |
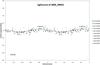 |
Fig. A.40
Rotational phase curve for 2005 RM43 obtained by using a spin period of 6.71 h. The dash line is a Fourier Series fit of the photometric data. Different symbols correspond to different dates. |
| Open with DEXTER | |
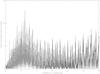 |
Fig. A.41
Lomb periodogram of Typhon. |
| Open with DEXTER | |
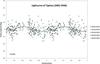 |
Fig. A.42
Rotational phase curve for Typhon obtained by using a spin period of 9.67 h. The dash line is a Fourier Series fit of the photometric data. Different symbols correspond to different dates. |
| Open with DEXTER | |
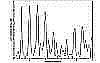 |
Fig. A.43
Lomb periodogram of 1996 TL66. |
| Open with DEXTER | |
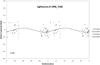 |
Fig. A.44
Rotational phase curve for 1996 TL66 obtained by using a spin period of 12 h. The dash line is a Fourier Series fit of the photometric data. Different symbols correspond to different dates. |
| Open with DEXTER | |
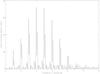 |
Fig. A.45
Lomb periodogram of Okyrhoe. |
| Open with DEXTER | |
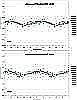 |
Fig. A.46
Rotational phase curves for Okyrhoe obtained by using different spin periods: 4.86 h (upper plot) and 6.08 h (lower plot). In both cases, we present a single peak lightcurve . The dash lines are a Fourier Series fits of the photometric data. Different symbols correspond to different dates. |
| Open with DEXTER | |
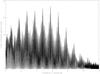 |
Fig. A.47
Lomb periodogram of 2005 UJ438. |
| Open with DEXTER | |
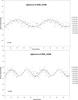 |
Fig. A.48
Rotational phase curve for 2005 UJ438 obtained by using a spin period of 4.16 h for the single peak lightcurve (upper plot) and a spin period of 8.32 h for the double peak lightcurve (lower plot). The dash line is a Fourier Series fit of the photometric data. Different symbols correspond to different dates. |
| Open with DEXTER | |
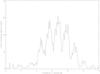 |
Fig. A.49
Lomb periodogram of 2007 UL126 (or 2002 KY14). |
| Open with DEXTER | |
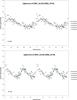 |
Fig. A.50
Rotational phase curves for 2007 UL126 (2002 KY14) obtained by using different spin periods: 3.56 h for the single peak lightcurve and 7.12 h for the double peak lightcurve. The dash lines are a Fourier Series fits of the photometric data. Different symbols correspond to different dates. |
| Open with DEXTER | |
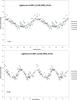 |
Fig. A.51
Rotational phase curves for 2007 UL126 (2002 KY14) obtained by using different spin periods: 4.2 h for a single peak lightcurve and 8.4 h for the double peak lightcurve. The dash lines are a Fourier Series fits of the photometric data. Different symbols correspond to different dates. |
| Open with DEXTER | |
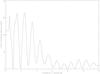 |
Fig. A.52
Lomb periodogram of Amycus. |
| Open with DEXTER | |
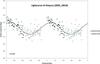 |
Fig. A.53
Rotational phase curve for Amycus obtained by using a spin period of 9.76 h. The dash line is a Fourier Series fit of the photometric data. Different symbols correspond to different dates. |
| Open with DEXTER | |
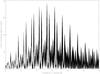 |
Fig. A.54
Lomb periodogram of 2003 CO1. |
| Open with DEXTER | |
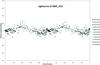 |
Fig. A.55
Rotational phase curve for 2003 CO1 obtained by using a spin period of 4.51 h. The dash line is a Fourier Series fit of the photometric data. Different symbols correspond to different dates. |
| Open with DEXTER | |
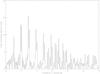 |
Fig. A.56
Lomb periodogram of 2003 WL7. |
| Open with DEXTER | |
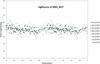 |
Fig. A.57
Rotational phase curve for 2003 WL7 obtained by using a spin period of 8.24 h. The dash line is a Fourier Series fit of the photometric data. Different symbols correspond to different dates. |
| Open with DEXTER | |
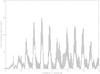 |
Fig. A.58
Lomb periodogram of 1999 TZ1. |
| Open with DEXTER | |
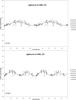 |
Fig. A.59
Rotational phase curve for 1999 TZ1 obtained by using a spin period of 5.211 h (upper plot) for the single peak lightcurve and 10.422 h (lower plot) for the double peak lightcurve. The dash line is a Fourier Series fit of the photometric data. Different symbols correspond to different dates. |
| Open with DEXTER | |
© ESO, 2010
Current usage metrics show cumulative count of Article Views (full-text article views including HTML views, PDF and ePub downloads, according to the available data) and Abstracts Views on Vision4Press platform.
Data correspond to usage on the plateform after 2015. The current usage metrics is available 48-96 hours after online publication and is updated daily on week days.
Initial download of the metrics may take a while.