Free Access
Fig. A.16
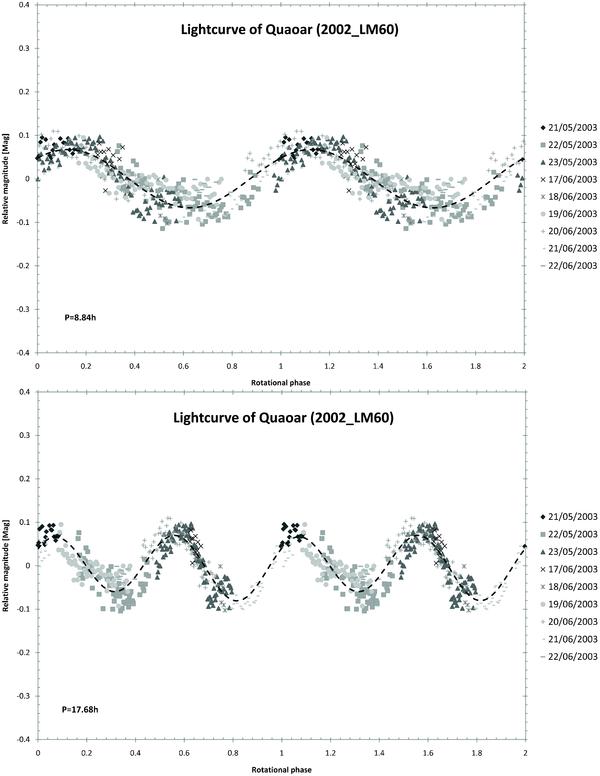
Rotational phase curve for Quaoar obtained by using a spin period of 8.84 h for the single peak lightcurve (upper plot) and a spin period of 17.68 h (lower plot) for the double lightcurve. The dash lines are a Fourier Series fit of the photometric data. Different symbols correspond to different dates.
This figure is made of several images, please see below:


Current usage metrics show cumulative count of Article Views (full-text article views including HTML views, PDF and ePub downloads, according to the available data) and Abstracts Views on Vision4Press platform.
Data correspond to usage on the plateform after 2015. The current usage metrics is available 48-96 hours after online publication and is updated daily on week days.
Initial download of the metrics may take a while.