| Issue |
A&A
Volume 519, September 2010
|
|
|---|---|---|
| Article Number | L4 | |
| Number of page(s) | 9 | |
| Section | Letters | |
| DOI | https://doi.org/10.1051/0004-6361/201014719 | |
| Published online | 14 September 2010 | |
Online Material
Appendix A: Photometric selection of z  2.2
LAE candidates from ALHAMBRA survey in GOODS-North
2.2
LAE candidates from ALHAMBRA survey in GOODS-North
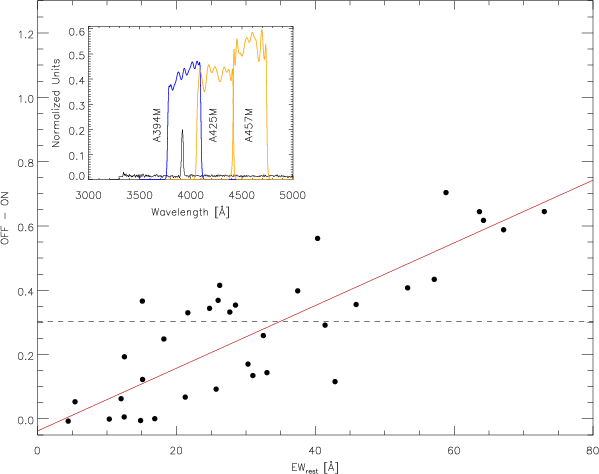
The method used for finding LAEs is based on a color-magnitude
diagnostic diagram.
The filter which samples the emission line is the ON filter and those
used to define the continuum constitute the OFF filters set. The choice
of the ON filter determines the range where the redshifts of the
candidates will be. In this way, we seleted the LAE candidates at
2.10<z<2.37 by using the filters
A394M as ON filter (owing to the official naming of
ALHAMBRA filters, the number between letters
gives the rounded central wavelength in nanometers; the last letter is
the acronym of ``Medium'' bandpass),
and a sum of A425M and A457M as
OFF filters, in order to increase the S/N
in the continuum.
Figure A.1
(inset) shows the
transmission curve of the chosen filters for LAE selection. Assuming an
effective filter width equal
to its FWHM, and taking into account the sky area
surveyed, as well as the emission line of interest, we
have explored in this way a comoving volume of about ![]() .
.
|
Figure A.1:
ALHAMBRA expected OFF-ON color of the VIMOS LAEs spectra at |
| Open with DEXTER | |
Once the ON and OFF filters were chosen, and according with the
ALHAMBRA survey sensitivity, we adopt a
limiting magnitude of 25.0 in the ON-band. Then, we elaborated
a color selection criterion to find LAEs
as efficiently as possible. We used the data from the GOODS/VIMOS
Spectroscopy DR 2.0.1
(Popesso et al. 2009)
to simulate the behavior of the SED from a typical LAE against the
selected
ALHAMBRA filters. From the whole spectroscopic catalog we selected the
objects that show a line which corresponds to a Ly![]() emission. Then the spectra were de-redshifted
so that the central wavelength of the lines were
within the transmission range of the ON filterin each case, as shown in
the example of Fig. A.1,
and
their rest frame equivalent widths were calculated. After this we were
able to compute the OFF-ON color by convolution of the filter profiles
with
each spectrum. In Fig. A.1
we represent this
color against the rest frame equivalent width of the lines, measured
with splot in IRAF.
As can be seen, there exists a relation between both variables, which
allows us to define a color selection
criterion. Our LAE candidates were selected to have rest-frame
equivalent widths
emission. Then the spectra were de-redshifted
so that the central wavelength of the lines were
within the transmission range of the ON filterin each case, as shown in
the example of Fig. A.1,
and
their rest frame equivalent widths were calculated. After this we were
able to compute the OFF-ON color by convolution of the filter profiles
with
each spectrum. In Fig. A.1
we represent this
color against the rest frame equivalent width of the lines, measured
with splot in IRAF.
As can be seen, there exists a relation between both variables, which
allows us to define a color selection
criterion. Our LAE candidates were selected to have rest-frame
equivalent widths
![]() .
According to Fig. A.1,
this value corresponds to a
threshold color of approximately 0.3 for both filter pairs. But taking
into account the photometric
errors, our adopted color selection criterion is
.
According to Fig. A.1,
this value corresponds to a
threshold color of approximately 0.3 for both filter pairs. But taking
into account the photometric
errors, our adopted color selection criterion is
![]() .
This translates the minimum rest-frame equivalent
width to
.
This translates the minimum rest-frame equivalent
width to ![]() at the limiting magnitude in the ON-band, corresponding
to Ly
at the limiting magnitude in the ON-band, corresponding
to Ly![]() luminosities of
luminosities of ![]() erg s-1
at z=2.2.
erg s-1
at z=2.2.
All photometric measures were performed with SExtractor (Bertin & Arnouts 1996) on the full processed and stacked images of the field ALHAMBRA-5, pointing 1. To calculate the color we used three arcsec aperture magnitudes and MAG_AUTO ones to plot the magnitudes of the objects. Sources with SExtractor nonzero flags were discarded.
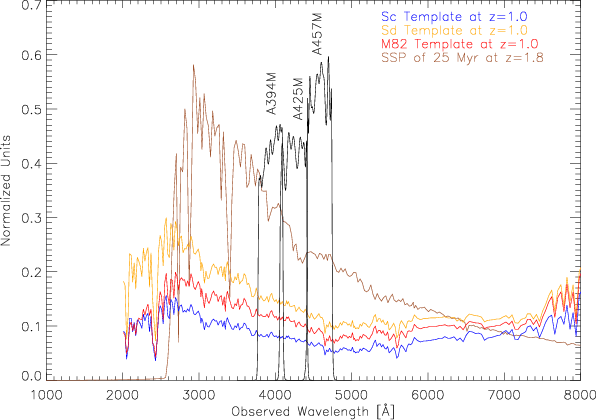
In order to study the nature of the possible continuum
contaminants we carried out simulations with galaxy templates
of BC03 (Bruzual & Charlot 2003)
and SWIRE (Polletta et al. 2007). We took
all the templates and redshifted them from z=0
to 3 in bins of
![]() .
We calculated their expected color and checked whether they satisfy the
color
selection criterion. As a result, we found that the contaminants appear
to be mainly starburst galaxies
at
.
We calculated their expected color and checked whether they satisfy the
color
selection criterion. As a result, we found that the contaminants appear
to be mainly starburst galaxies
at ![]() ,
whose UV rest-frame drop is sampled with the filters. As an example,
Fig. A.2
shows a set of spectra of different starburst templates that satisfy
the color criterium, although they are false positive candidates. More
details
of this study are included in a forthcoming paper (Oteo
et al., in prep.).
,
whose UV rest-frame drop is sampled with the filters. As an example,
Fig. A.2
shows a set of spectra of different starburst templates that satisfy
the color criterium, although they are false positive candidates. More
details
of this study are included in a forthcoming paper (Oteo
et al., in prep.).
|
Figure A.2: Spectra of possible contaminants. The transmission curves of the filter set used to select LAEs and spectra of possible contaminants at different redshifts, built from BC03 and SWIRE templates, are shown. The main contaminants are those whose UV continuum slope is sampled by the filters, resulting in the appearance of false-positive candidates. For the sake of clarity, the spectra and the transmission of the filters have been scaled. |
| Open with DEXTER | |
Appendix B: Data of z 2.2
LAE candidates in GOODS-North
|
Figure B.1:
Optical pseudo-spectra of |
| Open with DEXTER | |
Table B.1:
Combined data list of ![]() LAE candidates in the north-east half of the GOODS-North field.
LAE candidates in the north-east half of the GOODS-North field.
Table B.2:
Number counts of LAEs redshifts 2.2 and 3.1, limited in Ly![]() luminosity and rest-frame EW.
luminosity and rest-frame EW.
|
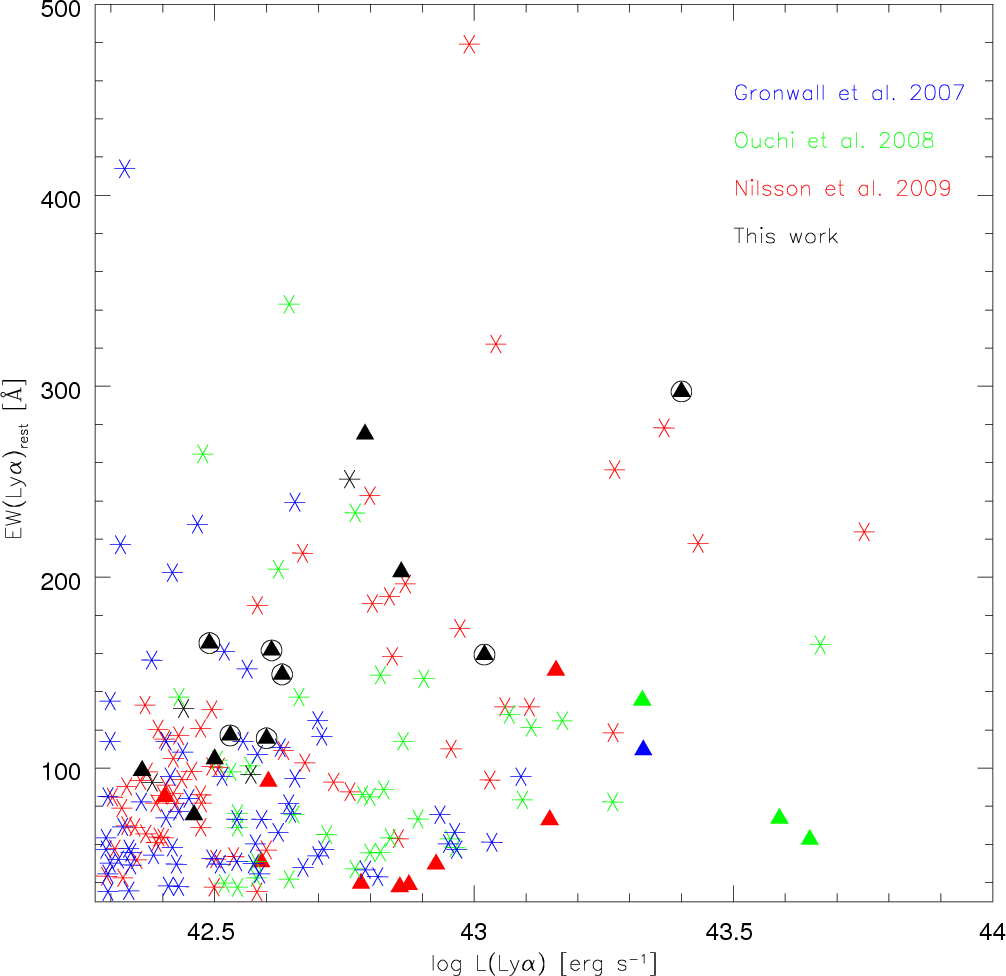
Figure B.1:
Rest-frame EW against Ly |
| Open with DEXTER | |
Current usage metrics show cumulative count of Article Views (full-text article views including HTML views, PDF and ePub downloads, according to the available data) and Abstracts Views on Vision4Press platform.
Data correspond to usage on the plateform after 2015. The current usage metrics is available 48-96 hours after online publication and is updated daily on week days.
Initial download of the metrics may take a while.