| Issue |
A&A
Volume 511, February 2010
|
|
|---|---|---|
| Article Number | A57 | |
| Number of page(s) | 25 | |
| Section | Extragalactic astronomy | |
| DOI | https://doi.org/10.1051/0004-6361/20079267 | |
| Published online | 10 March 2010 | |
Online Material
![\begin{figure}
\par\mbox{\subfigure[]{\psfig{figure=9267f15a.ps,width=7.5cm} }
\...
...hspace*{2cm}\subfigure[]{\psfig{figure=9267f15f.ps,width=7.5cm} }}\end{figure}](/articles/aa/olm/2010/03/aa9267-07/img119.png)
|
Figure 15: Results of hybrid imaging (contours) and circular Gaussian model fitting (circles with crosses) for S5 1803+784 at 15 GHz. |
| Open with DEXTER | |
![\begin{figure}
\par\mbox{\subfigure[]{\psfig{figure=9267f16a.ps,width=7cm} }
\hs...
...dth=7cm} }}\\
\subfigure[]{\psfig{figure=9267f16g.ps,width=7cm} }\end{figure}](/articles/aa/olm/2010/03/aa9267-07/img120.png)
|
Figure 16: Results of hybrid imaging (contours) and circular Gaussian model fitting (circles with crosses) for S5 1803+784 at 15 GHz; continuation of Fig. 15. |
| Open with DEXTER | |
![\begin{figure}
\par\mbox{\subfigure[]{\psfig{figure=9267f17a.ps,width=7.5cm} }
\...
...7.5cm} }}\\
\subfigure[]{\psfig{figure=9267f17e.ps,width=7.5cm} }\end{figure}](/articles/aa/olm/2010/03/aa9267-07/img121.png)
|
Figure 17: Results of hybrid imaging (contours) and circular Gaussian model fitting (circles with crosses) for S5 1803+784 at 8.4 GHz. |
| Open with DEXTER | |
![\begin{figure}
\par\mbox{\subfigure[]{\psfig{figure=9267f18a.ps,width=7cm} }
\hs...
...th=7cm} }}\\
\subfigure[]{\psfig{figure=9267f18e.ps,width=7cm} }\end{figure}](/articles/aa/olm/2010/03/aa9267-07/img122.png)
|
Figure 18: Results of hybrid imaging (contours) and circular Gaussian model fitting (circles with crosses) for S5 1803+784 at 5 GHz. |
| Open with DEXTER | |
|
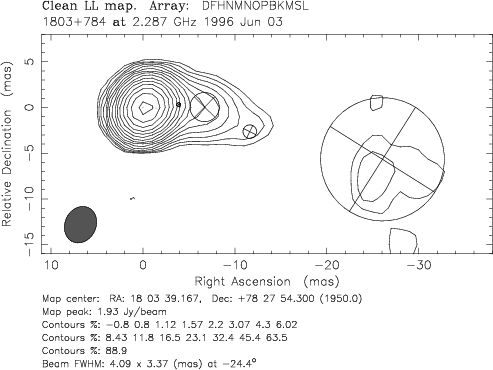
Figure 19: Results of hybrid imaging (contours) and circular Gaussian model fitting (circles with crosses) for S5 1803+784 at 2.3 GHz. |
| Open with DEXTER | |
![\begin{figure}
\par\mbox{\subfigure[]{\psfig{figure=9267f20a.ps,width=7.5cm} }
\hspace*{2cm}\subfigure[]{\psfig{figure=9267f20b.ps,width=7.5cm} }}\end{figure}](/articles/aa/olm/2010/03/aa9267-07/img124.png)
|
Figure 20: Results of hybrid imaging (contours) and circular Gaussian model fitting (circles with crosses) for S5 1803+784 at 1.6 GHz. |
| Open with DEXTER | |
Table 1: Circular Gaussian model-fit results for S5 1803+784. The columns list the epoch of observation, the jet-component identification, the flux density, the radial distance of the component center from the core, the position angle of the center of the component, the FWHM major axis, and the chi-square of the fit.
Table 2: Gaussian model-fit results for S5 1803+784 obtained from the literature. The columns list the epoch of observation, the jet-component identification, the flux density, the radial distance of the component center from the core, the position angle of the center of the component, the FWHM major axis, and for elliptical Gaussian fits, the axial ratio and the position angle of the major axis. The final column provides a reference to the original publication.
Table 7:
Discrete cross-correlations (based on components from the 8 GHz
model fits) and Pearson's correlation coefficients
(from 15 GHz model fits), calculated between the time series
of various pairs of jet parameters and/or the total flux densities.
Column 1 gives the frequency of the analyzed data set; Col. 2
lists the individual jet component from which the parameters to
correlate are taken; Cols. 3 and 4 list the parameters
correlated. For 8 GHz data, the DCF peak and ![]() are the peak of discrete cross-correlation function and the associated
time lag in years. For 15 GHz data, Corr.coeff. is
the value of the Pearson's correlation coefficient, and p is the probability of getting such a high correlation by chance.
are the peak of discrete cross-correlation function and the associated
time lag in years. For 15 GHz data, Corr.coeff. is
the value of the Pearson's correlation coefficient, and p is the probability of getting such a high correlation by chance.
Table 8:
Discrete cross-correlations (based on components from the 8 GHz
model fits) and Pearson's correlation coefficients
(from 15 GHz model fits), calculated for various pairs jet
parameters and the core flux density. Column 1 gives the frequency
of the analyzed data set; Cols. 2 and 3 lists the two jet
components participating in the correlation; Col. 4 shows the
circular Gaussian parameter correlated. When ``core'' is the first
component, its parameter is always flux-density.
For 8 GHz data, DCF peak and ![]() are the peak of the discrete correlation function and the associated
time lag in years. For 15 GHz data, Corr.coeff. is the value
of the Pearson's correlation coefficient, and p the probability of getting such a high correlation by chance.
are the peak of the discrete correlation function and the associated
time lag in years. For 15 GHz data, Corr.coeff. is the value
of the Pearson's correlation coefficient, and p the probability of getting such a high correlation by chance.
Current usage metrics show cumulative count of Article Views (full-text article views including HTML views, PDF and ePub downloads, according to the available data) and Abstracts Views on Vision4Press platform.
Data correspond to usage on the plateform after 2015. The current usage metrics is available 48-96 hours after online publication and is updated daily on week days.
Initial download of the metrics may take a while.