| Issue |
A&A
Volume 508, Number 2, December III 2009
|
|
|---|---|---|
| Page(s) | 565 - 574 | |
| Section | Cosmology (including clusters of galaxies) | |
| DOI | https://doi.org/10.1051/0004-6361/200912745 | |
| Published online | 01 October 2009 | |
Online Material
Appendix A:
We have computed yields for Si, Fe and Ni for different models of Ia and core-collapsed supernovae.
The ones for SNIa originate from two physically distinct sets of models taken from Iwamoto et al. (1999), namely the slow deflagration (W7 and W70) and the delayed detonation (WDDs and CDDs) explosion models. We have computed silicon, iron and nickel yields for a given SNIa model by summing over all stable isotopes the synthesized amount of Si, Fe and Ni per SN event given in Table A.1 of Iwamoto et al. (1999).
For core-collapsed supernovae we use the yields from Nomoto et al. (2006),
Chieffi & Limongi (2004) and Woosley & Weaver (1995).
In these cases we first averaged the yields over the initial mass
function (IMF) of the stellar population as follows:
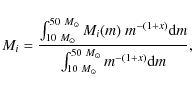
|
(A.1) |
where Mi(m) is the ith element mass produced by a star of mass m. We consider two IMF: a standard Salpeter (1955) function with exponent x=1.35, and a top-heavy function with x=0.95(Arimoto & Yoshii 1987, thereafter AY), which predicts a relatively larger number of massive stars. The integration mass range is between 10 and 50 solar masses, in agreement with Nomoto et al. (2006).
Table A.1: Yields of elements in solar masses for different SNe models. Type Ia yields were calculated for each element for the W7, W70, WDD1, WDD2, WDD3 and CDD1, CDD2 models in Iwamoto et al. (1999). SN core-collapsed yields (including types Ib and Ic) were calculated from the results in Nomoto et al. (2006) integrating over a progenitor initial mass function. We have considered two different initial mass functions, the Salpeter function with index 1.35 and the AY top-heavy function with index 0.95, and we have integrated between 10 and 50 solar masses. The initial metallicity of the progenitors is Z=0.02 (i.e. solar).
Table A.2: Yields of Si and Ni relative to Fe in solar units of Anders & Grevesse (1989) for the same SNe models used in Table A.1.
The derived yields of Si, Fe and Ni in units of solar masses per supernova explosion are reported in Table A.1. For core-collapsed supernovae we report results for the standard Salpeter and the AY top-heavy IMF.
Inspection of Table A.1 reveals how much yields differ from one model to the other. Fe is characterized by the smallest scatter, 10% for SNIa and 18% for SNcc, Si is less constrained, 27% for SNIa and 19% for SNcc, Ni features the largest variations, 46% for SNIa and 41% for SNcc. Note also that the choice of IMF produces only a modest impact on the yields.
The derived SNIa yields of Si and Ni relative to iron in Anders & Grevesse (1989) solar units are reported in Table A.2. Ratios in Grevesse & Sauval (1998) units can be easily computed by multiplying both the Si/Fe and Ni/Fe values in Table A.2 by 0.675, whereas ratios in Lodders (2003) units are obtained by multiplying Si/Fe by 0.65 and Ni/Fe by 0.68, and, ratios in Asplund et al. (2005) units by multiplying Si/Fe by 0.67 and Ni/Fe by 0.72 (for the solar Ni we have used the updated value by Scott et al. 2009).
The derived yields of Si and Ni relative to iron in solar units for SNcc for different progenitor metallicities and IMFs are reported in Table A.2. Conversion factors for different solar units systems are the same as given above.
The yields relative to Fe for all our SNcc models are also listed in a recent review paper (Werner et al. 2008). Unfortunately some of the values reported in that paper are incorrect, in some cases, by a large amount, i.e. the Ni yields for the Woosley & Weaver (1995) models. We have corresponded with the authors who are now considering publishing a revised version of their tables.
Table 1: Starting sample of 32 galaxy clusters extracted from the X-ray flux limited B55 sample (Edge et al. 1990).
Table 2: Relative differences between metal measurements made with the three EPIC instruments MOS1, MOS2 and pn computed over the whole sample.
Table 3: Measurements of silicon, iron and nickel abundances relative to the solar value (Anders & Grevesse 1989) for the final sample (26 clusters for Si and Fe, 23 for Ni) from the 4T mekal spectral model.
Table 4: Averages of Si, Fe, Ni abundances and Si/Fe, Ni/Fe ratios for the cool core cluster sample in solar units.
Table 5:
Supernovae type Ia mass fraction,
![]() ,
obtained for different
theoretical SNe silicon-to-iron and nickel-to-iron ratios from the
observed Si/Fe and Ni/Fe ratios.
,
obtained for different
theoretical SNe silicon-to-iron and nickel-to-iron ratios from the
observed Si/Fe and Ni/Fe ratios.
Table 6:
Supernovae type Ia fraction,
![]() ,
obtained for different theoretical SNe models from the observed Si/Fe
and Ni/Fe abundance ratios. SNIa and SNcc models are the same as in
Table 5.
,
obtained for different theoretical SNe models from the observed Si/Fe
and Ni/Fe abundance ratios. SNIa and SNcc models are the same as in
Table 5.
Current usage metrics show cumulative count of Article Views (full-text article views including HTML views, PDF and ePub downloads, according to the available data) and Abstracts Views on Vision4Press platform.
Data correspond to usage on the plateform after 2015. The current usage metrics is available 48-96 hours after online publication and is updated daily on week days.
Initial download of the metrics may take a while.