| Issue |
A&A
Volume 506, Number 3, November II 2009
|
|
|---|---|---|
| Page(s) | 1319 - 1333 | |
| Section | Stellar structure and evolution | |
| DOI | https://doi.org/10.1051/0004-6361/200810526 | |
| Published online | 27 August 2009 | |
Online Material
Appendix A: Overview of available spectroscopic observations
Table A.1:
Journal of available RV observations of ![]() Tau.
Tau.
We secured and reduced 117 electronic spectra of ![]() Tau
which cover the spectral region containing the Si II 6347 and
6371 'A doublet, H
Tau
which cover the spectral region containing the Si II 6347 and
6371 'A doublet, H![]() and He I 6678 'A lines.
The spectra were obtained at the Ondrejov Observatory and at the
Dominion Astrophysical Observatory (DAO hereafter) in the period
from 1993 to 2006. Additional 167 H
and He I 6678 'A lines.
The spectra were obtained at the Ondrejov Observatory and at the
Dominion Astrophysical Observatory (DAO hereafter) in the period
from 1993 to 2006. Additional 167 H![]() echelle CCD spectra were secured at
the Ritter Observatory. They have a resolution of 26 000 and the spectrograph
is described in Morrison et al. (1997). We also newly reduced a selection of
32 McDonald red CCD spectra, originally used by Kaye & Gies (1997), choosing
usually the first and the last spectrogram of each night series.
Three spectra of
echelle CCD spectra were secured at
the Ritter Observatory. They have a resolution of 26 000 and the spectrograph
is described in Morrison et al. (1997). We also newly reduced a selection of
32 McDonald red CCD spectra, originally used by Kaye & Gies (1997), choosing
usually the first and the last spectrogram of each night series.
Three spectra of ![]() Tau found in the ELODIE archive of the Haute Provence
Observatory were also rectified and measured.
Moreover, 219 Ondrejov photographic coudé spectra from
the years 1967-1992 were digitized with the microdensitometer
of the Slovak Academy of Sciences at Stará Lesná.
They consist of 36 red spectra, which cover the spectral region
containing the Si II 6347 and 6371 'A doublet, H
Tau found in the ELODIE archive of the Haute Provence
Observatory were also rectified and measured.
Moreover, 219 Ondrejov photographic coudé spectra from
the years 1967-1992 were digitized with the microdensitometer
of the Slovak Academy of Sciences at Stará Lesná.
They consist of 36 red spectra, which cover the spectral region
containing the Si II 6347 and 6371 'A doublet, H![]() and He I 6678 'A
lines and of 183 blue and violet spectra.
Additionally, 59 medium-dispersion spectra from Castanet-Tolosan
were used for the equivalent-width and line-intensity measurements
and He I 6678 'A
lines and of 183 blue and violet spectra.
Additionally, 59 medium-dispersion spectra from Castanet-Tolosan
were used for the equivalent-width and line-intensity measurements![]() .
.
The initial reductions of spectra were performed using the IRAF
(CCD700, UBC-1, McDonald, and Ritter spectra), MIDAS (Heros spectra) and SPEFO
(Reticon and photographic spectra) programs.
All subsequent reductions and the RV and spectrophotometric
measurements were carried out using the SPEFO reduction program
written by the late Dr. J. Horn and recently further developed by
Dr. J. Krpata (Horn et al. 1996; Skoda 1996). The only exception is the series of
Ritter H![]() spectrograms for which NR measured the H
spectrograms for which NR measured the H![]() -emission wing bisector
velocities at
-emission wing bisector
velocities at ![]() 350 km s-1 from the line center using the convolution
method of Shafter et al. (1986).
350 km s-1 from the line center using the convolution
method of Shafter et al. (1986).
A.1 Radial-velocity data files
We carried out a critical compilation of all available RV measurements
of H I and He I lines from the literature with
the known dates of observations. A large part
of these RVs has already been used by Harmanec (1984) but some revision
was deemed desirable![]() . These were complemented by additionally published RVs
and by our own RV measurements in a large collection of the photographic
spectra secured at Ondrejov and in many electronic spectra
from the observatories mentioned above. In cases when the original sources
give the dates and times of mid-exposures we used the program HEC19 to
derive heliocentric Julian dates
. These were complemented by additionally published RVs
and by our own RV measurements in a large collection of the photographic
spectra secured at Ondrejov and in many electronic spectra
from the observatories mentioned above. In cases when the original sources
give the dates and times of mid-exposures we used the program HEC19 to
derive heliocentric Julian dates![]() .
The journal of all RVs used in this study is in Table A.1.
Julian dates and RVs are tabulated with the accuracy available in the
original sources. All Julian dates with 3 or 4 decimal digits are
heliocentric ones.
.
The journal of all RVs used in this study is in Table A.1.
Julian dates and RVs are tabulated with the accuracy available in the
original sources. All Julian dates with 3 or 4 decimal digits are
heliocentric ones.
A few comments to individual data files follow. The files are identified by the spectrograph Nos. given in Table A.1. Note that we were trying to retain the spectrograph numbers used by Harmanec (1984) but two changes were inevitable as detailed below.
- Spg. 1 (Adams 1905): The dates of midexposures tabulated in the original paper are given to 1 decimal digit only;
- Spg. 2 (Losh 1932): The Julian dates tabulated in the original paper are heliocentric ones;
- Spg. 3&6 (Herman & Duval 1963): Julian dates of all spectra are only given to one decimal place. For the last Perkins Observatory spectrogram it follows from the tabulated date 1957 Dec. 14 that the Julian date is JD 2436187.8, not JD 2436188.8 given in their Table II. We adopted this corrected value but admit that we have no chance to decide whether the date or JD in Table II is in error;
- Spg. 4 and 8 (Underhill 1952): Harmanec (1984) treated all MtWilson spectrograms as coming from one spectrograph. However, the first five of them are from a prism spectrograph while the remaining ones are from a grating spectrograph. We, therefore, assigned the first 5 spectra as coming another spectrograph, No. 8.
- Spg. 5 (Underhill 1951): The date of the last few spectrograms Nos. 41717-19, 1951 Jan 29.534, is obviously incorrect: From the comparison with the follow-up study by Underhill (1952) and from the logic we deduce that the correct date should be 1951 Jan 29.234;
- Spg. 5 (van der Wel 1970): These RV measurements are tabulated in the original paper as mean values from several consecutive spectra for individual Balmer lines. We used the mean RV of H5-H7 and H9-H12 lines, which are available in all spectra. We omitted the RV of H8 line since it seems to be affected by the blending with the He I 3888 line. The tabulated RVs are actually coming from three different grating spectrographs, attached to the 1.83-m a 1.22-m telescopes of the DAO, and to the KPNO 2.1-m reflector. Harmanec (1984) indeed treated them as three different spectrographs Nos. 5, 7, and 8. Considering that in some cases the mean RVs come from both DAO spectrographs, that only a single KPNO RV is tabulated in the original paper, and that all measurements were carried out by the same investigator, we decided treat all these RVs as coming from the 1.83-m DAO spectrograph. The exact dates are only available for three single spectrograms taken on Nov 9, 1964, Dec. 9 a 15, 1964 a (probably) also Jan. 9, 1966. For these spectra, we derived and tabulated HJDs to four decimal digits. All other spectra have only less accurate mean (topocentric) JDs.
- Spg. 6 (Gögköz et al. 1963): We adopted the H I RVs only for the OHP spectrograms W406 a W567, since RVs from all other OHP spectra were published in more detail by Delplace (1970a). We could not get He I RVs from this study since only their RVs averaged with the RVs of metallic lines are tabulated there.
- Spg. 6 (Delplace 1970a): We derived the median H I RVs for the H9-H18 lines tabulated in the original source. Thanks to Ilovaisky (2006, priv. com.) and Hubert (2008, priv. com.) we were able to derive the accurate HJDs for these spectrograms. This way, we also became aware of a few misprints in Delplace (1970a) paper: Plate W2880 is actually W2879. The date of the plate W3311 is January 3, 1961, not January 13, 1961 as given in the paper. Also the published JD is in error. We therefore also derived the heliocentric corrections of RV for both dates and found that it was necessary to increase the published RVs of the plate W3311 for +4.89 km s-1.
- Spg. 7 (Abt & Levy 1978): These authors tabulated HJDs.
- Spg. 9 (Miczaika 1953): Julian dates are tabulated to only 1 decimal place but the H I RVs are given to two decimal places.
- Spg. 10 (Gökgöz et al. 1962): For the spectra from the Merate Observatory, only days of observations are tabulated. Therefore, our deduced Julian dates might be incorrect by one day in some instances.
- Spg. 11 (Aydin et al. 1965): For these grating spectra, Julian dates of mid-exposures are tabulated to two decimal digits only. We corrected the Julian dates of the spectrograms Nos. 978, 984, 986, 1044, and 1623 for a half-a-day error.
- Spg. 12 (Guo et al. 1995): Spectrograms with several different dispersions were measured but we take all data as coming from one instrument. The individual RVs have larger-than-usual scatter and we decided to adopt as the most accurate the mean from H4-H6 lines. HJDs are tabulated by the authors.
- Spg. 13 (Jarad 1987): These He I RVs are derived via cross-correlation and the author tabulates heliocentric MJDs (not HJDs) of mid-exposures.
- Spg. 14 (Kaye & Gies 1997): These authors studied rapid line-profile
variations in a series of McDonald 2.1-m CCD spectrograms and published RVs of the mean H
 ,
H
,
H ,
He I
,
He I  6678, and Fe II 4924 line profiles from six nights of observing. They found that the superior conjunction predicted by their new RVs occurred 0
 12 earlier than predicted by ephemeris (1) (Harmanec 1984). When revisiting the data published by Kaye & Gies (1997),
we were unable to positively confirm that heliocentric corrections were
applied to each of the reduced spectra. We therefore re-reduced the
original (raw) spectra to derive new RVs and spectrophotometry values
in order to have the most uniform data set possible and to eliminate
any chance that the heliocentric correction may be missed in this
analysis.
12 earlier than predicted by ephemeris (1) (Harmanec 1984). When revisiting the data published by Kaye & Gies (1997),
we were unable to positively confirm that heliocentric corrections were
applied to each of the reduced spectra. We therefore re-reduced the
original (raw) spectra to derive new RVs and spectrophotometry values
in order to have the most uniform data set possible and to eliminate
any chance that the heliocentric correction may be missed in this
analysis.
A.2 Spectrophotometric data
Table A.2:
Journal of available spectrophotometric H![]() observations of
observations of ![]() Tau .
Tau .
Similarly as for RVs, we carried out a critical compilation of all available measurements of the H![]() line
intensities and equivalent widths (EW) with the known dates of
observations. These quantities were also measured on many photographic
spectra secured at Ondrejov and electronic spectra from Ondrejov, DAO,
OHP, and Castanet-Tolosan observatories. The journal of all
spectrophotometric measurements used in this study is
in Table A.2.
line
intensities and equivalent widths (EW) with the known dates of
observations. These quantities were also measured on many photographic
spectra secured at Ondrejov and electronic spectra from Ondrejov, DAO,
OHP, and Castanet-Tolosan observatories. The journal of all
spectrophotometric measurements used in this study is
in Table A.2.
The individual data files are identified there by letters.
All intensities (if not stated otherwise) were measured on published
H![]() profiles.
profiles.
Below, we provide a few comments on individual data files:
- File A (Underhill 1953): The published profile is a mean profile of three observations and the mean time of observation is given as civil date.
- File B (Delplace 1970b): The published profiles are identified by phase of the long-term cycle which is tabulated with EW and plate numbers. The plate numbers 2639 and 3171 given in Table 9 of Delplace (1970b) correspond to the blue (3100-5200 'A) plates. Plate denoted 3171 is most probably 3172, while 2639 can be either 2638 or 2659. We have chosen 2659 because for plate 2638 a slightly different phase is given in Table 7 of Delplace (1970b). The accurate times of mid-exposures for the OHP plates were kindly provided by Dr S. Illovaisky.
- File C (Aydin et al. 1965): Julian dates are tabulated to two decimal places (three decimal places in the case of spectrum No. 1898).
- Files D and E (van der Wel 1970): For the spectrum taken on
Dec. 9, 1964 (H
profile published by
Underhill & van der Wel 1967) we could not decide if it was
recorded on 08:27 or 09:40 UT so the mean time was used as the time of
observation.
- File F (Guo et al. 1995): Only dates of observations are tabulated
together with the H
emission-peak intensities and EW. The exception are
6 spectra obtained in Dec. 1983 for which accurate times of observations are
published together with the H
profiles.
Guo et al. (1995) calculated the V/R ratio as
(IV-1)/(IR-1), so their
values are not used and the V/R ratio was calculated from the given peak
intensities.
- File G (Andrillat & Fehrenbach 1982): Four values of the H
EW and V/R are
given. However, Andrillat & Fehrenbach (1982) measured intensities of the emission from
the underlying photospheric line. Consequently, their V/R ratio is
not comparable to the values used in this study. Times of observations are given as civil dates.
- File H (Hanuschik et al. 1996): Julian dates to one decimal place are
given by Hanuschik et al. (1988) for five spectra obtained in 1982.
Dachs et al. (1992) tabulated the Julian date to three decimal places together
with the H
intensities and EW for a spectrum obtained in 1987.
The times of observations for the remaining two spectra are given as civil
dates.
- File I (Rachkovskaya & Nasibova 1986): Julian dates to three decimal places are tabulated together with the EW and the V/R ratio.
- File J (Galkina 1985): Julian dates to three decimal places
are tabulated together with the H
emission-peak intensities, EW and
the V/R ratio.
- File K (Ballereau et al. 1987): Julian dates to three decimal places
are tabulated together with the H
intensities, EW and the V/R ratio.
- File L (Slettebak et al. 1992): The intensities, EW and V/R ratios are tabulated. The times of observations are given as civil dates.
- File M (Vakili et al. 1998): Accurate times of observations are tabulated as well as the V/R ratio. Vakili et al. (1998) measured the intensities from the continuum, so their V/R values are not used, and the intensities were measured on the published profiles.
- File N (Moultaka et al. 2004): FITS files were downloaded from the ELODIE archive and measured by us.
- File O (Guo et al. 1995; Guo 1994): Guo (1994) tabulated
the H
intensities and EW. The times of observations are given as civil
dates to three decimal places.
- File P (Rivinius et al. 2006): The intensities of the H
emission
peaks and the V/R ratio are tabulated together with HJDs.
- File Q (Banerjee et al. 2000): The time of observation is given as civil date.
- File R (Pollmann & Rivinius 2008): The H
profiles are tabulated as
intensity versus wavelength. The wavelength range for the time
interval JD 2451850.5-2452737.3 is 6545.0-6577.9 'A while
for JD 2452883.6-2454174.4, the range is 6545.2-6579.8 'A.
The EWs measured in the H
profiles from the first time interval
are systematically smaller by several 'A than the ones obtained from
the high-resolution spectra secured in about the same time.
Consequently, these Pollman's EWs are not used here.
The Julian dates are given to one decimal place.
- File S (Wisniewski et al. 2007): The time of observation is given as civil date.
Appendix B: Photometry
Table B.1:
Journal of available photometry of ![]() Tau with known times of observations.
Tau with known times of observations.
Table B.3:
Mean ![]() values for the check stars used at individual
observing stations derived differentially relative to their respective
comparison stars (cf. Table B.1). They illustrate how closely
the data could be transformed to a comparable standard system.
values for the check stars used at individual
observing stations derived differentially relative to their respective
comparison stars (cf. Table B.1). They illustrate how closely
the data could be transformed to a comparable standard system.
- Observations by Köllnig-Schattschneider (1940): These 1940 Heidelberg
photoelectric observations were obtained with a potassium diode.
Several other known variables and binaries were also observed.
From a comparison of phase curves for some binaries observed by
Köllnig-Schattschneider (1940) with more recent observations we had concluded
that the accuracy of these early observations is too low to be
valuable in the study of the relatively mild light changes of
 Tau.
Thus, we gave up on the attempts to transform these observations to the
B and V magnitudes and have not used them.
Tau.
Thus, we gave up on the attempts to transform these observations to the
B and V magnitudes and have not used them.
- Station 01 - Hvar: These observations were reduced to the standard UBV system via non-linear transformation formulæ using the HEC22 reduction program - see Harmanec et al. (1994) and Harmanec & Horn (1998). The first part of them was secured in the course of the international campaign on photometry of Be stars (Harmanec et al. 1982) and has already been analyzed by Pavlovski et al. (1997), Pavlovski & Bozic (1982) and by Bozic & Pavlovski (1988) and published in detail by Harmanec et al. (1997). The 1999-2007 observations are published and analyzed for the first time here. Observations since 2000 were reduced with a more sophisticated HEC22 rel.16 program which can also model time variation of linear extinction coefficients in the course of observing nights.
- Station 04 - Ondrejov: These
 observations were secured
by several Ondrejov astronomers and reduced to the standard
magnitudes with the HEC22 program.
observations were secured
by several Ondrejov astronomers and reduced to the standard
magnitudes with the HEC22 program.
- Station 08 - Xing-Long: These observations were also secured
as part of the international campaign on photometry of Be stars. They
represent normal points of several individual observations for each
night. They were reduced and transformed to the standard
system
by Guo et al. (1995) using the HEC22 program.
- Station 09 - Sarajevo: These
observations were
obtained at the Colina Kapa mountain station by Messrs. M. Muminovic
and M. Stupar and provided as a part of the international campaign.
We reduced these data the to standard
system using the HEC22 rel.16
program and non-linear seasonal transformation formulæ.
- Station 15 - Fairborn: These
observations were secured
at the request of D. McDavid with the 0.25-m Automatic Photometric Telescope
(APT). They were reduced via linear transformation formulæ into
the standard
system by the APT service, a non-profit service
directed by Professor Michael Seeds.
- Station 20 - Toronto: This limited set of
observations
comes from the photometric archive of Dr. J.R. Percy. They were reduced
to the
system via linear transformation formulæ by their author.
The observations were obtained in support of the international program
but never published.
- Station 23 - Catalina: These original UBV all-sky observations were published with dates of observations by Johnson et al. (1966). We converted their tabulated JDs into HJDs.
- Station 26 - Haute Provence: A mean value of three 1968-1969
observations was published by Haupt & Schroll (1974) and the individual B and Vmagnitude differences were communicated privately to P. Harmanec.
The times of observations are known with
an accuracy of
 0.1 d. The observations were reduced to the
system by their authors and we only added the Hvar mean all-sky values
to their magnitude differences.
0.1 d. The observations were reduced to the
system by their authors and we only added the Hvar mean all-sky values
to their magnitude differences.
- Station 30 - San Pedro Mártir: These all-sky observations
were secured with the 6 red filters by Schuster & Guichard (1984). We cannot
transform these observations to the standard
system and we only
used the m58 magnitude (which is reasonably close to Johnson V)
to monitor the long-term changes.
- Station 37 - Jungfrauhof: These all-sky 7-C observations
were secured in the Geneva photometric system and kindly put at our
disposal by Dr. G. Burki (priv. com. to PH). We transformed them into
magnitudes using the transformation formulæ derived by Harmanec & Bozic (2001).
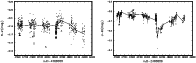
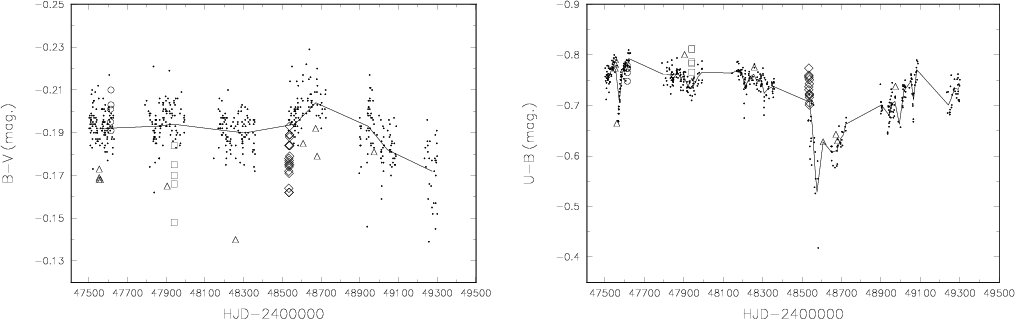
Figure B.1: Time plots of
 and
and  indices of Tau based on various observations secured over the time interval covered by the Hipparcos
  observations and shortly before and after it. Following notation
is used to distinguish data from various stations identified
in Table B.1:
01... empty circles, 08... empty triangles up, 09... empty squares,
15... small black dots, 73... empty diamonds. The solid lines are
connecting the normals points over 100 d in
and over 15 d in
- see the text for details.
observations and shortly before and after it. Following notation
is used to distinguish data from various stations identified
in Table B.1:
01... empty circles, 08... empty triangles up, 09... empty squares,
15... small black dots, 73... empty diamonds. The solid lines are
connecting the normals points over 100 d in
and over 15 d in
- see the text for details.

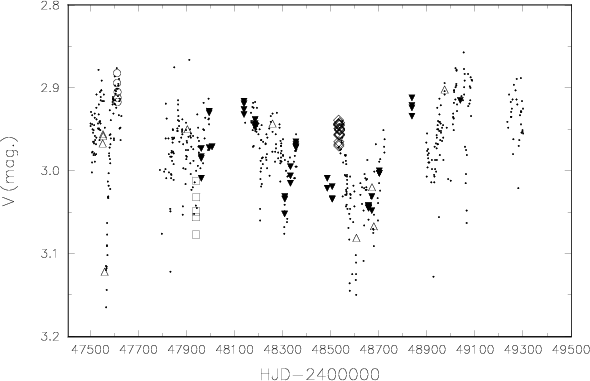
Figure B.2: Time plots of V photometry of
Tau based on various
observations secured over the time interval covered by the Hipparcos
observations and shortly before and after it. Following notation
is used to distinguish data from various stations identified
in Table B.1:
01... empty circles, 08... empty triangles up, 09... empty squares,
15... small black dots, 73... empty diamonds. The solid lines are
connecting the normals points over 100 d in
and over 15 d in .
Hipparcos
magnitudes transformed to Johnson V are shown by
black triangles down. See the text for the details.
- Station 49 - Limber Observatory: These observations were
secured and reduced by David McDavid at his private observatory as a part of
the international campaign on photometry of Be stars relative to 126 Tau.
We only added the standard Hvar
all-sky values of 126 Tau
of Table B.2 to the magnitude differences derived by DMD.
- Station 61 - Hipparcos: These observations were reduced to the
standard V and B magnitudes via the transformation formulæ derived by Harmanec (1998). Since the star underwent long-term colour variations
over the period 1989-93, covered by Hipparcos observations - as illustrated
by Fig. B.1 - we proceeded in the following way:
We first derived suitably chosen normal points of observational data
secured shortly before, during and shortly after the Hipparcos observations
at several stations. It turned out that the
changes were best
described by 100-d normals while the more pronounced
variations
were characterized by 15-d normals. Then we derived smooth lines passing
through the normal points with the help of a non-linear interpolation based on
Hermite polynomials using program INTEP by Hill (1982). With them,
we derived the appropriate values of
and
for the times
of individual
observations and these values were used to transform
individual Hipparcos observations to Johnson V after Harmanec (1998).
The resulting V magnitudes are compared with the true V observations
from other stations in Fig. B.2. A very satisfactory
agreement is seen there. Note also that Figs. B.1 and B.2
illustrate the level of (dis)agreement of magnitudes and indices from
individual observing stations.
- Station 73 - Piskéstetö: These
observations,
used in the paper by Percy et al. (1994), were obtained by Dr. M. Paparo and kindly put at our disposal for analyses in the form of magnitude differences Tau - 126 Tau and 121 Tau - 126 Tau, transformed to the standard system
and corrected for differential extinction. These observations will be
later published by their author and are not, therefore, included in
Table 4. Regrettably, the other set of photometry
used by Percy et al. (1994), obtained at Braeside Observatory, is not available.
- Station 95 - Tucson: These 8C all-sky observations were obtained
and published by Johnson et al. (1967) and we transformed them to the
magnitudes using the transformation formulæ derived by Harmanec & Bozic (2001).
Current usage metrics show cumulative count of Article Views (full-text article views including HTML views, PDF and ePub downloads, according to the available data) and Abstracts Views on Vision4Press platform.
Data correspond to usage on the plateform after 2015. The current usage metrics is available 48-96 hours after online publication and is updated daily on week days.
Initial download of the metrics may take a while.