| Issue |
A&A
Volume 501, Number 3, July III 2009
|
|
|---|---|---|
| Page(s) | 1013 - 1030 | |
| Section | Stellar structure and evolution | |
| DOI | https://doi.org/10.1051/0004-6361/200811073 | |
| Published online | 29 April 2009 | |
Online Material
Table 1: Journal of FEROS observations and radial velocity measurements.
Table 2:
Radial velocity determinations, both from gaussian fit and bisector method, and equivalent widths of H![]() and [O I] 6300 Å measured on FEROS spectra.
and [O I] 6300 Å measured on FEROS spectra.
Table 4:
Equivalent widths of H![]() and [O I] 6300 Å
measured on the low-resolution spectra (see the atlas in electronic form)
and corresponding total extinction, AV, obtained as described in
Sect. 8.
and [O I] 6300 Å
measured on the low-resolution spectra (see the atlas in electronic form)
and corresponding total extinction, AV, obtained as described in
Sect. 8.
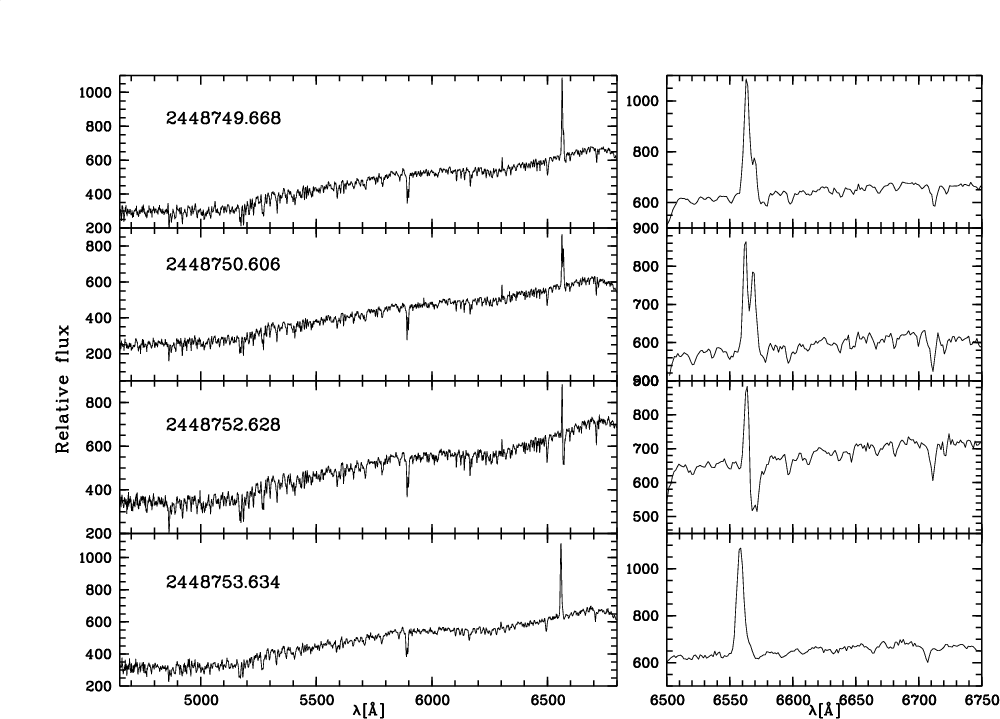 |
Figure 21:
Atlas of low-resolution spectra of T Cha. The panels on the left side display the whole range,
those on the right show the interval containing H |
| Open with DEXTER | |
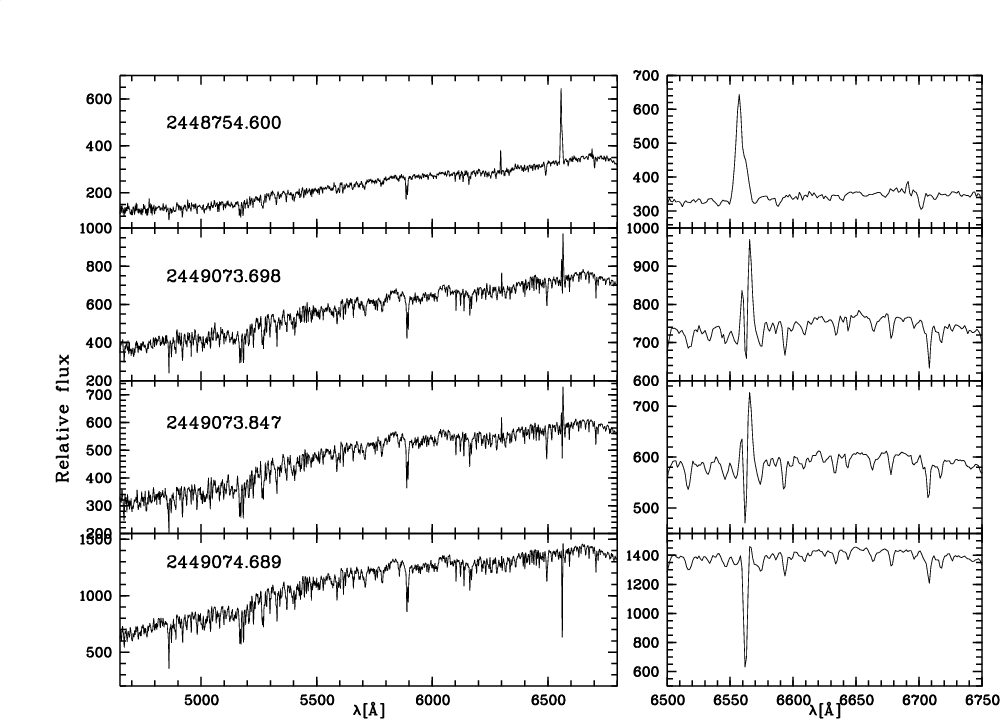 |
Figure 22: Atlas of low-resolution spectra of T Cha, continue. |
| Open with DEXTER | |
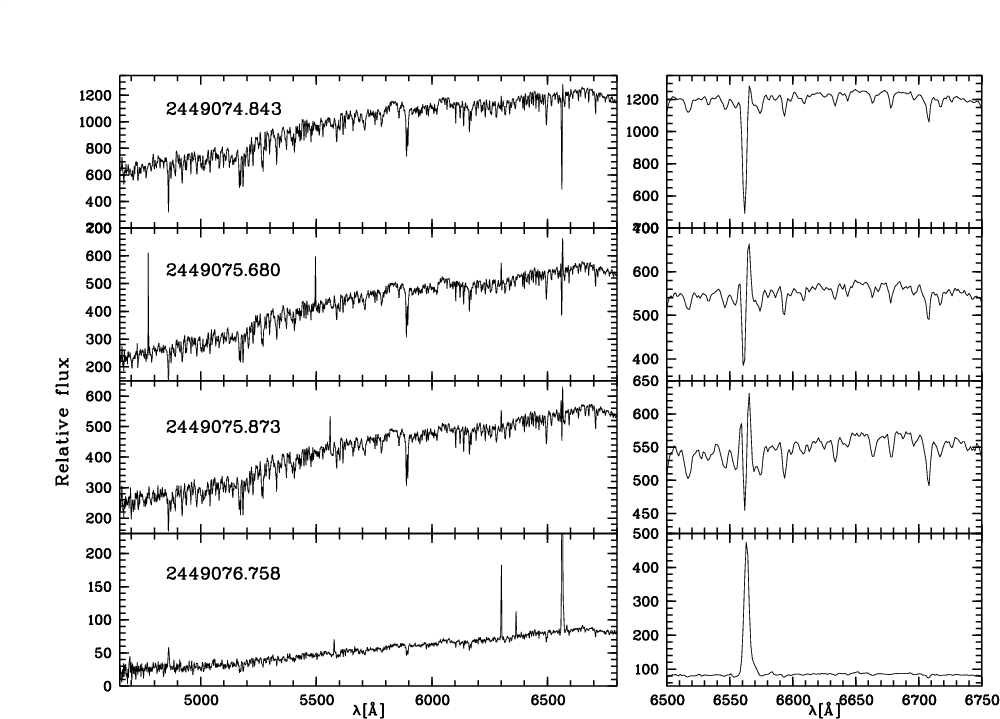 |
Figure 23: Atlas of low-resolution spectra of T Cha, continue. |
| Open with DEXTER | |
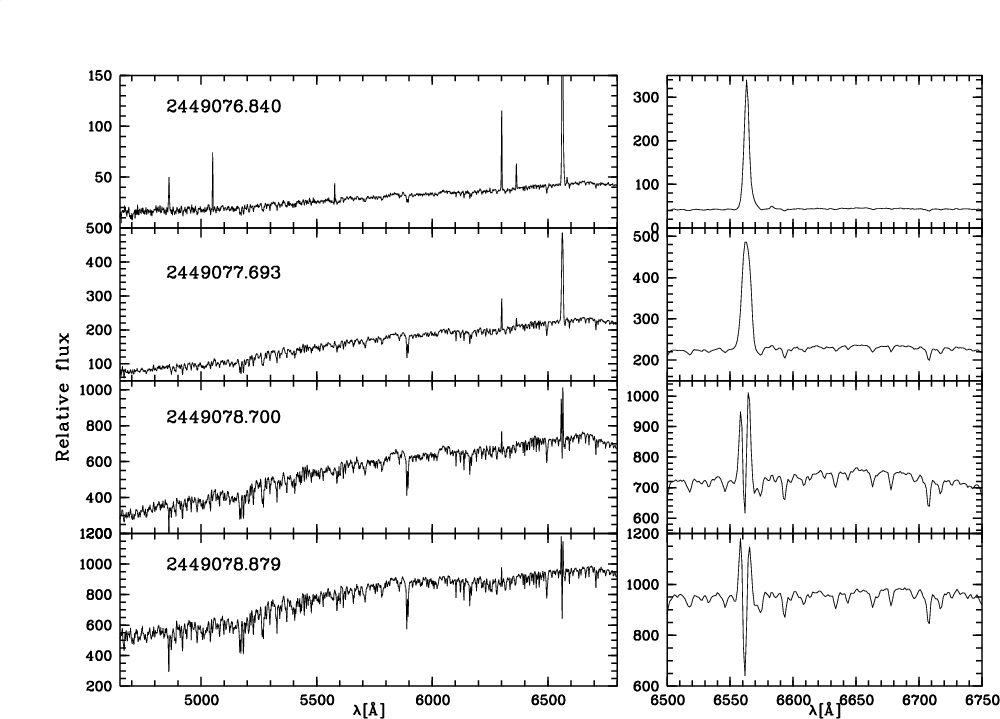 |
Figure 24: Atlas of low-resolution spectra of T Cha, continue. |
| Open with DEXTER | |
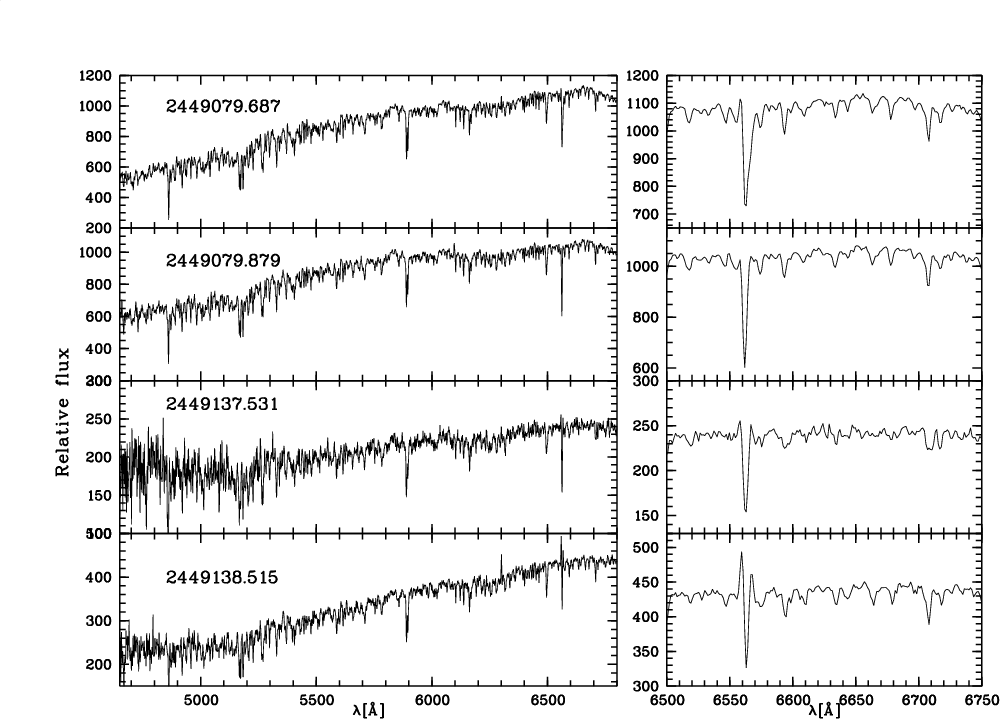 |
Figure 25: Atlas of low-resolution spectra of T Cha, continue. |
| Open with DEXTER | |
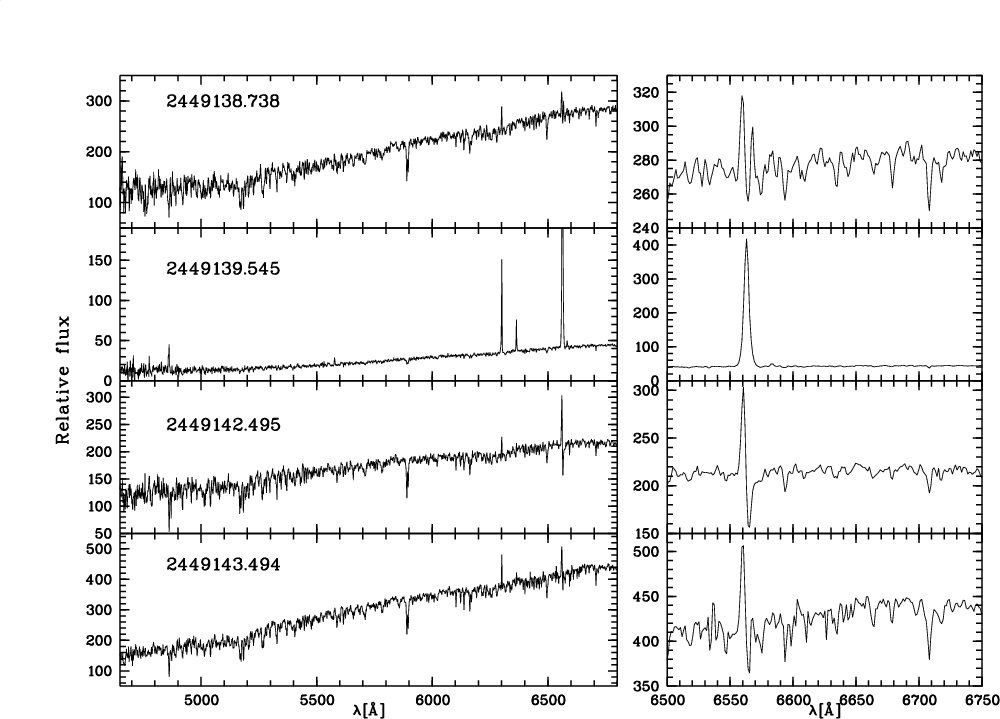 |
Figure 26: Atlas of low-resolution spectra of T Cha, continue. |
| Open with DEXTER | |
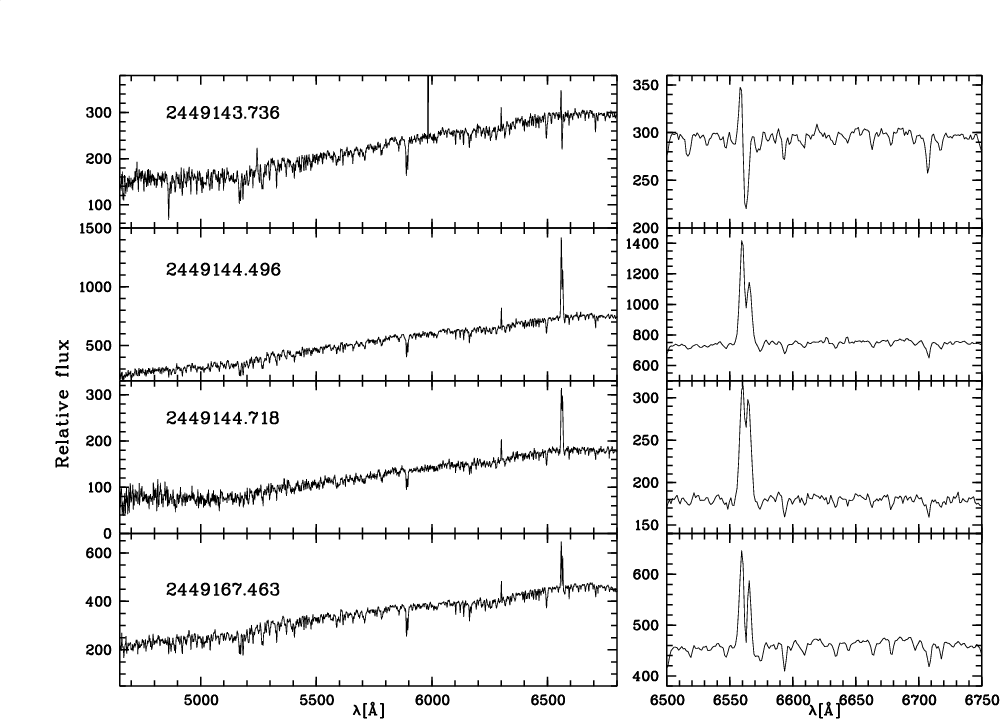 |
Figure 27: Atlas of low-resolution spectra of T Cha, continue. |
| Open with DEXTER | |
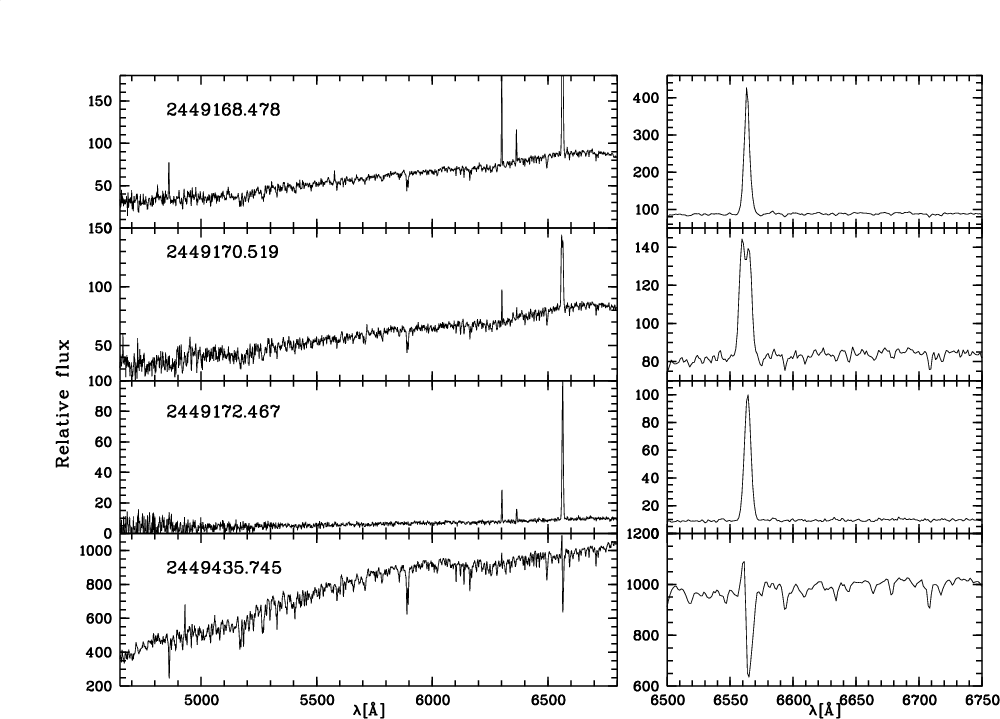 |
Figure 28: Atlas of low-resolution spectra of T Cha, continue. |
| Open with DEXTER | |
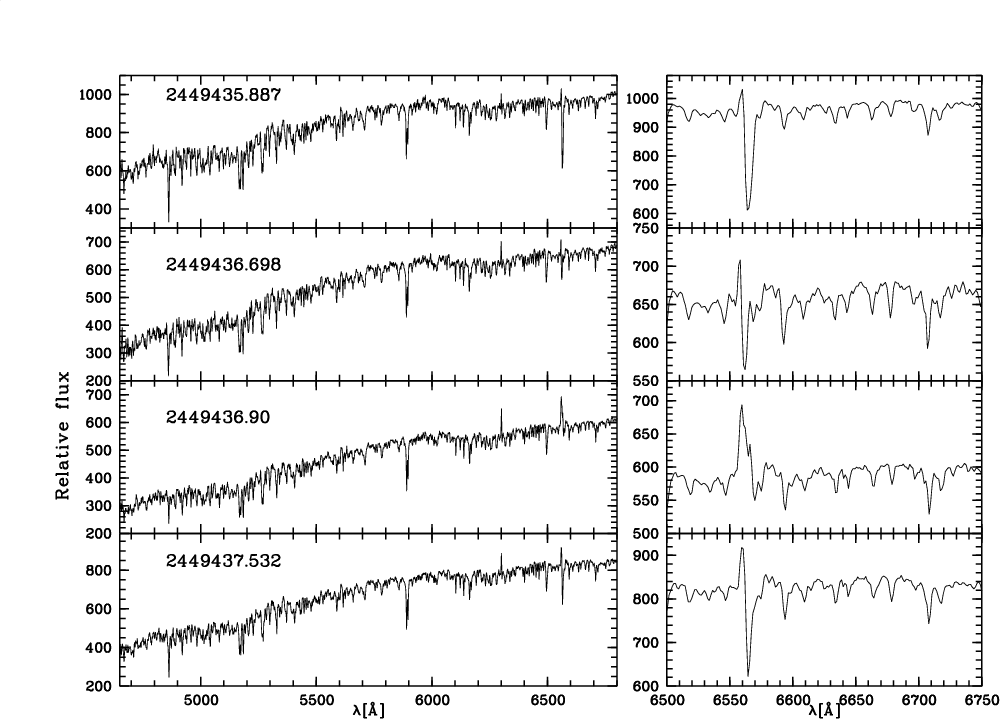 |
Figure 29: Atlas of low-resolution spectra of T Cha, continue. |
| Open with DEXTER | |
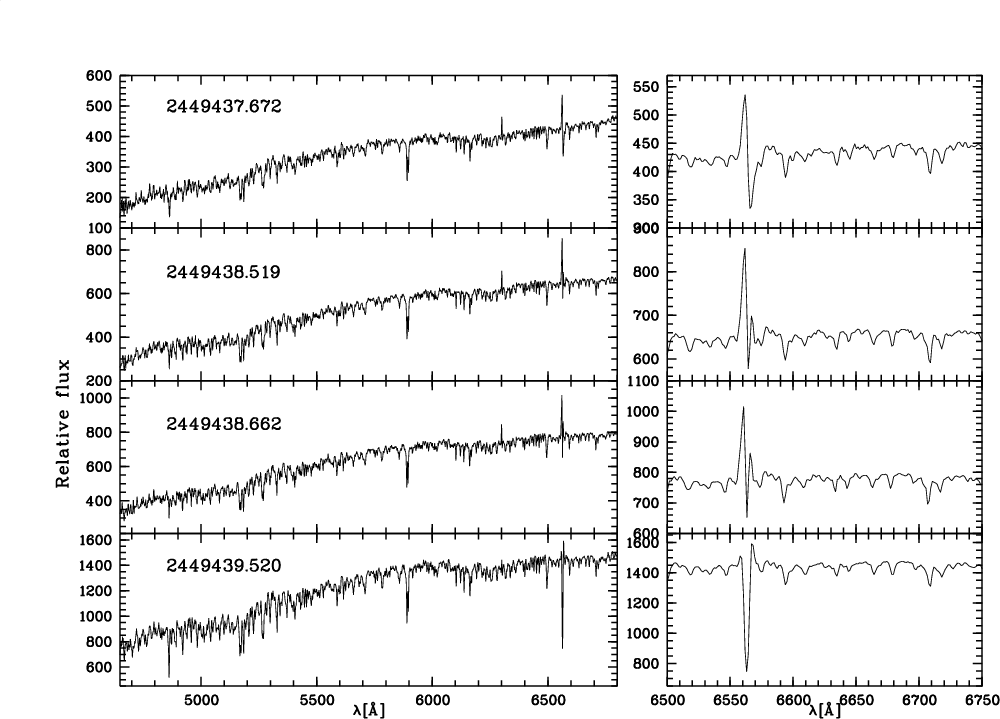 |
Figure 30: Atlas of low-resolution spectra of T Cha, continue. |
| Open with DEXTER | |
![\begin{figure}
\par\includegraphics[origin=rb,angle=-90,width=17cm,height=10cm,clip]{1073f31.ps}
\end{figure}](/articles/aa/olm/2009/27/aa11073-08/img136.png) |
Figure 31: Atlas of low-resolution spectra of T Cha, continue. |
| Open with DEXTER | |
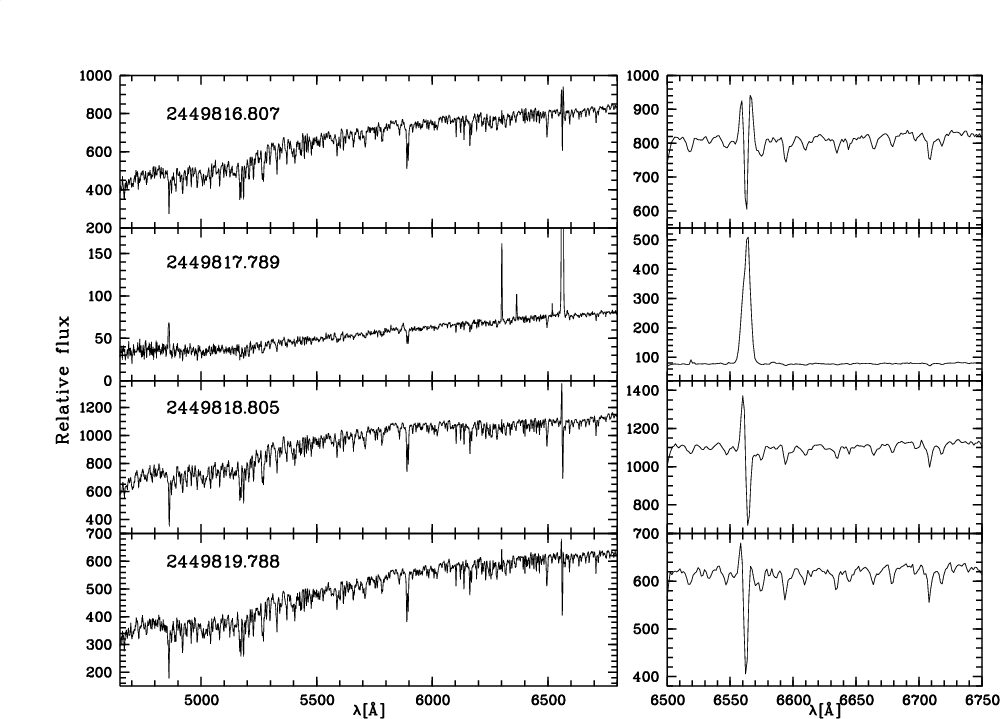 |
Figure 32: Atlas of low-resolution spectra of T Cha, continue. |
| Open with DEXTER | |
Current usage metrics show cumulative count of Article Views (full-text article views including HTML views, PDF and ePub downloads, according to the available data) and Abstracts Views on Vision4Press platform.
Data correspond to usage on the plateform after 2015. The current usage metrics is available 48-96 hours after online publication and is updated daily on week days.
Initial download of the metrics may take a while.