


| Issue |
A&A
Volume 712, August 2026
|
|
|---|---|---|
| Article Number | L5 | |
| Number of page(s) | 4 | |
| Section | Letters to the Editor | |
| DOI | https://doi.org/10.1051/0004-6361/202660966 | |
| Published online | 30 July 2026 | |
Letter to the Editor
A very rapidly rotating white dwarf in nova YZ Reticuli
1
Universidad Nacional de Hurlingham (UNAHUR). Laboratorio de Investigación y Desarrollo Experimental en Computación, Grupo de Astrofísica, Av. Gdor. Vergara 2222, Villa Tesei, Buenos Aires, Argentina
2
Consejo Nacional de Investigaciones Científicas y Técnicas (CONICET), Argentina
3
South African Astronomical Observatory, PO Box 9 Observatory, Cape Town, 7935, South Africa
4
International Gemini Observatory/NSF NOIRLab, Casilla 603, La Serena, Chile
5
INAF-Osservatorio Astronomico di Padova, vicolo Osservatorio, 5, 35122 Padova, Italy
6
Department of Astronomy, University of Wisconsin, 475 N. Charter Str., Madison WI 53706, WI, USA
7
Centre for Extragalactic Astronomy, Department of Physics, Durham University, South Road, Durham DH1 3LE, UK
8
INAF – Osservatorio Astronomico di Capodimonte, Salita Moiariello 16, I-80131 Naples, Italy
9
Advanced Technologies Research Institute, Faculty of Materials Science and Technology in Trnava, Slovak University of Technology in Bratislava, Bottova 25, 917 24 Trnava, Slovakia
★ Corresponding author: This email address is being protected from spambots. You need JavaScript enabled to view it.
Received:
15
May
2026
Accepted:
4
July
2026
Abstract
YZ Ret (Nova Reticuli 2020) is the first VY Scl-type nova-like variable observed to have undergone a classical nova eruption. Following the outburst, a timing analysis of 20-s cadence TESS data revealed a periodicity at approximately 42 s, suggesting its plausible classification as a fast-spinning intermediate polar (IP). To definitively identify the nature of this modulation, we performed a multi-instrument timing analysis using high-speed ground-based photometry Zorro/Gemini South (1 s cadence) and the South African Astronomical Observatory (5 s cadence) alongside TESS Sector 97 observations. Our ground-based data reveal a highly coherent period of 37.69131 ± 0.00001 s, which we identified as the true rotation period of the white dwarf. We demonstrate that the apparent 42.61 s signal in the TESS data is a Nyquist alias of this fundamental frequency. Furthermore, the signal amplitude in the TESS data is suppressed by a factor of ≈0.6 relative to the Gemini observations, a result that is consistent with the theoretical sinc-function damping expected for a 20-s integration time. The extreme coherence and long-term stability of the 37.69131 s signal rule out transient phenomena such as dwarf nova oscillations or non-radial pulsations. We conclude that YZ Ret hosts a fast-spinning magnetic white dwarf in an IP configuration. This discovery implies that mass loss during the nova eruption was likely driven by a fast magnetic rotator wind and provides a physical explanation for the missing supersoft X-ray phase, suggesting that nearly the entire accreted envelope was exhausted, promptly quenching the process of nuclear burning.
Key words: novae / cataclysmic variables / stars: individual: YZ Reticuli
© The Authors 2026
 Open Access article, published by EDP Sciences, under the terms of the Creative Commons Attribution License (https://creativecommons.org/licenses/by/4.0), which permits unrestricted use, distribution, and reproduction in any medium, provided the original work is properly cited.
This article is published in open access under the Subscribe to Open model. This email address is being protected from spambots. You need JavaScript enabled to view it. to support open access publication.
1. Introduction
YZ Ret (MGAB-207) has revealed the “first” instances of a number of astrophysical phenomena: prior to the outburst, it was one of the few novae already known as cataclysmic variables (CVs); it was later classified as a VY Scl-type nova-like after its brightness was reported to fade by about two magnitudes for prolonged periods of time (Murawski 2019); in early July 2020, YZ Ret was discovered as a bright, “naked-eye” classical nova when it reached V ≈ 3.7 (see Sokolovsky et al. 2022, and references therein); and, finally, thanks to the low column density towards the source, this was the nova for which the long-predicted initial X-ray flash of the “fireball” phase was first detected (König et al. 2022).
Early post-outburst observations revealed a system in rapid transition, characterized by intense super-soft X-ray emission and complex optical variability. It is important to note that the super-soft luminous X-ray source was never observed and we return to this point in our conclusions. It has been tentatively explained based on its high inclination, which led to the central source becoming obscured by the disk (Sokolovsky et al. 2022; Mitrani et al. 2024). This allowed for an analysis of the shocks occurring at a late phase of the outburst in the nova ejecta, which collided with a thin shell of previously ejected cold and dense material, thereby producing a spectrum with several features from radiation recombination continua. This also stands as the best evidence (and the first case for a nova) of an astrophysical object beyond the Sun undergoing the charge exchange phenomenon (see Mitrani et al. 2024).
In this Letter, we present compelling evidence of the magnetic nature of the white dwarf through a comprehensive timing analysis. We utilize a combination of space-based photometry from the Transiting Exoplanet Survey Satellite (TESS) and ground-based Gemini South (GS) as well as SAAO high-speed photometry to resolve the nature of the system’s periodicity in the high frequency range. In Section 2, we describe the data and analysis techniques. Section 3 presents our results, while Section 4 interprets them in the context of the nova aftermath. In Section 5, we summarize our conclusions.
2. Observations and data analysis
2.1. TESS
YZ Ret was observed by TESS in Sectors 3, 4, 29, 30, 31 and 69. These data had already been analyzed and presented in Schaefer (2022). It was also more recently observed in Sectors 96 and 97 (PI: Scaringi). In this Letter, we concentrate on the observation of sector 97, which has a 20 s cadence light curve available (PI: Scaringi) from the Barbara A. Mikulski Archive for Space Telescopes (MAST)1. The observations of Sector 97 started on September 15 2025 and lasted for 54.62 days. At this time,YZ Ret was still about 1-g magnitude above the pre-nova quiescent level, as shown in Fig. 1, where we plot the g-magnitude light curve from the ASAS-SN archive (Kochanek et al. 2017).
 |
Fig. 1. Multiwavelength long-term light curve of YZ Ret covering the period 2017-2026, starting in quiescence until the most recent observations. The panel shows the optical evolution from ASAS-SN. Vertical colored regions indicate the epochs of high-cadence TESS observations analyzed by Schaefer (2022) and in this work (TESS Sectors 3, 4, 29, 30, 31, 69, 96, and 97), X-ray observations from Swift, Chandra, and XMM-Newton, and high-speed ground-based photometry from GS/Zorro and SAAO. The light curve illustrates the transition from the post-outburst decline to the current VY Scl-type high state, providing the temporal context for the detected white dwarf spin. |
2.2. South African Astronomical Observatory
Observations of YZ Ret were obtained in the V band with the 1.9-m telescope equipped with the Sutherland High-Speed Optical Camera (SHOC) at the South African Astronomical Observatory (SAAO), Sutherland. Individual exposures of 5 s were acquired using GPS-triggered timing. The target was monitored on 11 and 13 March 2026, with an average coverage of approximately 1.1 h per night. A data reduction process followed standard procedures implemented in Python, primarily using photutils (v2.2.0; Bradley et al. 2016) together with the Astropy-affiliated package astroquery.gaia (Astropy Collaboration 2013, 2018). The instrumental magnitudes were extracted via aperture photometry. The photometric calibration was performed using two field stars with magnitudes in the Gaia archive2. Synthetic g-band magnitudes derived from Gaia photometry were used to determine the photometric zero-point and calibrate the target light curve.
2.3. Gemini South/Zorro
YZ Ret was observed with the Zorro fast dual-channel camera3 mounted on the Gemini South telescope (Scott et al. 2021; Howell et al. 2025). The observations were carried out on 26 March 2026 as part of the Director’s Discretionary Time program GS-2026A-DD-105 (PI: G. J. M. Luna). Zorro was operated in wide-field mode, with the target positioned at the center of the ∼35 arcsec diameter unvignetted field of view. The blue and red channels were configured with 2 × 2 binning and a 1024 × 1024 pixel window, using the XSDSS g′ filter, centered at 479 nm, and the XSDSS i′ filter, centered at 765 nm, respectively. The EMCCD detectors were operated as conventional CCD imagers, acquiring a two-hour time series consisting of four sequences of 1750 frames each, for a total of 7000 frames per channel, with a cadence of 1 s. The observations were obtained under photometric conditions, with an average seeing of ∼0.8″.
Because no suitable comparison star was available within the Zorro wide-field of view, aperture photometry was performed on the target alone after standard bias and flat-field corrections. The target counts were extracted within a circular aperture of radius 2″ and analyzed using AstroImageJ (Collins et al. 2017). The g′ and i′ light curves were analyzed independently and produced consistent results; for clarity, only the g′ light curve is shown in Figure 2.
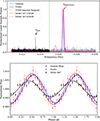 |
Fig. 2. Top: Multi-instrument power spectrum analysis of YZ Ret. The plot compares the power spectra from GS, SAAO and TESS, each one normalized by their peak power for illustration purposes. The TESS data are shown both within its nominal sampling regime (black) and its reflected power beyond the Nyquist (dashed green line) frequency (gray), illustrating the P ≈ 42.61 s alias. All instruments consistently resolve a dominant coherent peak at f ≈ 0.02652 Hz (P ≈ 37.691 s), definitively identifying the white dwarf spin period and resolving sampling ambiguities. Moreover, although it was not significantly detected, two peaks on the side of the main peak in the TESS power spectrum have frequencies that are consistent with those arising from the beat between the spin and orbital periods, ω − Ω and ω + Ω. Bottom: Phase-folded optical light curves of YZ Ret normalized to the mean flux. Two phase cycles are shown for clarity, with the modulation maximum manually aligned at ϕ = 0.5. Solid lines represent the best-fit sinusoidal models for each dataset. The observed reduction in the TESS modulation amplitude relative to GS is fully consistent with the theoretical attenuation factor (≈0.59) derived from the finite integration time (sinc-function damping) being attributed to the undersampling of the 20 s cadence. |
2.4. Timing analysis
We constructed the periodograms of each light curve using the Lomb-Scargle (LS) algorithm, as implemented in the astropy library (Astropy Collaboration 2022), and we adopted its standard normalization. We focused on the frequencies above 0.005 Hz, which had not been sampled in the previous analysis of TESS data by Schaefer (2022). In this frequency region, the LS periodogram was dominated by white noise; thus, we applied the standard determination of the false alarm probability (FAP) at the 99.9% level. The uncertainty of the detected period was estimated using a Monte Carlo approach combined with a residual bootstrapping technique. After identifying the strongest peak suspected to be the primary frequency in the original Lomb-Scargle periodogram, we subtracted the corresponding best-fit sinusoidal model from the data to isolate the residuals. We then generated N = 1000 synthetic light curves by adding the best-fit model to a randomized version of the residuals, obtained through bootstrapping. The periodogram was re calculated for each synthetic dataset and the formal uncertainty was defined as the standard deviation of the resulting distribution of periods.
3. Results
Our analysis of the TESS Sector 97 periodogram in the frequency range above 0.005 Hz and up to fNyquist = 0.025 Hz revealed a strong peak in the frequency fTESS = 0.023468 Hz (PTESS = 42.61050 ± 0.00003 s). Given the 20 s cadence of the TESS data and the “uncomfortably” close proximity of fTESS to fNyquist, before going further into its interpretation in the context of YZ Ret, we obtained the observations with SAAO and GS mentioned in the previous sections. With 5 s and 1 s cadences, we extended the Nyquist limit to 0.1 and 0.5 Hz, respectively.
The LS periodograms of the SAAO and GS data revealed a dominant signal at a frequency of fSAAO ≈ fGS ≈ 0.02653 Hz (see Fig. 2). Therefore, we identify the frequency, fTESS, as a Nyquist alias of the true frequency. Specifically, fTESS and fSAAO/GS satisfy the mirroring relationship,
 (1)
(1)
Given the 20-s cadence of the TESS observations, which implies fNyquist = 0.025 Hz), the fundamental frequency observed by SAAO and GS is reflected across the Nyquist limit into the nominal sampling regime. As illustrated in Fig. 2, the signal at 0.02347 Hz in the TESS data is a sampling artifact (alias) of the true physical period at 37.691 s, which is correctly resolved by higher precision ground-based photometry.
At this point, we must consider the reason behind this scenario. First, we note that the “strobe effect” might be illustrative in this regard. At every TESS frame of 20 s, the rotating body (in our interpretations: the white dwarf itself) has completed more than one full rotation per integration period (Ptrue = 37.69131 ± 0.00001 s). When we analyzed the TESS light curve, we could only see that phase wrap-around (and thus the rotation) seems slower (PTESS = 42.6105 s).
The nature of the 37.691 s periodicity was investigated through a multi-instrument comparison of the pulse profiles (see Fig. 2, bottom panel). We derived fractional semi-amplitudes (A = [Imax − Imin]/2Imean) by performing weighted least-squares sinusoidal fits to the three phase-binned datasets. The high-cadence GS observations revealed an intrinsic semi-amplitude of 0.00778 ± 0.00052 in the g′-band. In the case of TESS Sector 97, the semi-amplitude was reduced to 0.00452 ± 0.00035, a factor that is approximately 0.58 times smaller; however, it is agreement with the theoretical damping factor of 0.59 expected for a 37.691 s signal sampled at a cadence, Δt of 20 s (sinc-function attenuation; (ATESS = Atrue × |sinc(πΔt/P)|)). The stability of the modulation is further confirmed by the SAAO data, which yield a semi-amplitude of 0.00873 ± 0.00084. This value is consistent with the GS semi-amplitude after accounting for the negligible sampling damping at a 5 s cadence (factor ≈0.97).
4. Discussion
In view of the evidence presented, we conclude that the optical emission of YZ Ret is characterized by a highly coherent modulation with a period of 37.69131 ± 0.00001 s. The stability of this periodicity over the five-month baseline between the TESS and GS-SAAO observations suggests a fundamental origin, most likely associated with the rotation of a magnetic white dwarf. Such long-term frequency stability is inconsistent with typical dwarf nova oscillations (DNOs), which are known for their transient nature and rapid decoherence on timescales of minutes to hours (Warner 2004). Furthermore, the persistence of this signal in the current post-outburst high state (VY Scl phase, sometimes called “anti-dwarf novae” Leach et al. 1999) is difficult to reconcile with the DNO phenomenon, further supporting the classification of YZ Ret as a fast-spinning intermediate polar (IP).
Alternative interpretations involving non-radial stellar pulsations (e.g., g-modes or p-modes) can also be excluded. Gravity-modes (g-modes) always exhibit periods longer than 100 s (e.g. Saio 2013) and in accreting WDs, these periods have been detected only in dwarf novae, where the accretion rate is low during quiescence (see Szkody 2021, and references therein). Both the current fading state after the nova and the nova-like nature of YZ Ret implies a high accretion rate that would possibly prevent the WD from cooling to below the upper limit of the pulsation instability strip (Teff < 15 000 K; Arras et al. 2006). On the other hand, pressure-mode (p-mode) oscillations, which are driven by compressibility, are expected to have much shorter periodicities (i.e., generally below 10 s for a typical white dwarf mass). The detected 37.691 s period falls between these two regimes and it seems unlikely to be related to those known intrinsic stellar pulsations mechanisms.
5. Conclusions
We discovered a fast optical periodicity in the post-nova YZ Ret and managed to definitively resolve the ambiguity surrounding its true value. By bridging the gap between TESS observations and high-speed ground-based photometry, we identified a stable 37.691 s white dwarf spin period. Taking into account the orbital period reported by Schaefer (2022) of 3.179 h, the beat frequencies, ω − Ω and ω − Ω are 0.02644 Hz and 0.026618 Hz, respectively. Neither of them have been significantly detected above the noise level, although hints of their presence can be observed in the TESS power spectrum, lending support to the identification of Ptrue as the white dwarf spin. This discovery firmly classifies YZ Ret as an IP, thereby making it one of the fastest-spinning magnetic white dwarfs known in a post-nova system.
The stability of the spin frequency over 120 days, combined with the predictable amplitude suppression in the undersampled TESS data, provides a definitive identification with the white dwarf’s rotation. This resilient magnetic accretion regime continues to drive the system’s behavior even as it continues to remain in a post-nova high state. The persistence of this spin signal, despite the disruption of a classical nova eruption and the system’s subsequent return to a VY Scl-type high state, underscores the resilience of the magnetic accretion.
The ratio of spin and orbital periods Pspin/Porb ≈ 0.0033 is nearly two orders of magnitude smaller than that of typical IP (Pspin/Porb ∼ 0.1). Among a handful of novae already classified or proposed as IPs (see Table 1 by Orio et al. 2022 and references therein, and recent results in Orio et al. 2024), YZ Ret has been identified as having the shortest period.
In a few other novae, several different short periods, even as short as the proposed rotation period of YZ Ret (and intriguingly close to it, N LMC 2009: 33 s; KT Eri and RS Oph: ≃35 s) have often been detected in the supersoft X-ray source in outburst (see Orio et al. 2022, and numerous references therein). However, the shortest periods of only few tens of seconds have not been (or not yet) measured again in quiescence, so their root cause remains elusive; however, we do note that it might be due to non-radial pulsations of some type.
A further interesting implication is that during the fireball phase or shortly thereafter, the rapidly expanding envelope may have reached or exceeded the break-up rotational velocity. At this stage, however, the wind was probably already active and extremely fast, driven not by common-envelope expansion or by the radiation-pressure mechanisms typically invoked in nova models (see, among others, Bath & Shaviv 1976; Kato & Hachisu 1989; Shen & Quataert 2022), but instead by magnetic effects associated with rapid rotation (Orio et al. 1992).
For a magnetic or centrifugal rotator wind to occur, a primary mass loss trigger has to initiate the wind before it becomes sustained by the magnetic rotator. This initial trigger may be simply due to the thermonuclear runaway (TNR) shock wave in the envelope, especially if it is abundantly enriched with CNO nuclei by mixing. In a nova with a slowly rotating WD, the shock wave of the TNR may not last long enough to lose a significant amount of mass (see discussion in Starrfield et al. 2012a,b), but with such a high rotation velocity and magnetic field in the case of IPs, the shock wave could stand as the trigger behind the fast magnetic rotator wind. Alternatively, mass might start “flying away” in the expanding envelope because the radius is larger than the break-up radius.
We strongly encourage further studies at optical wavelengths to measure the system’s orbital parameters. If the orbital inclination turns out to be much higher than hypothesized by Sokolovsky et al. (2022) and the WD would therefore not be significantly obscured by the disk, then it is likely that the combined effect of rapid rotation and magnetic field in this nova has caused the rapid, complete (or almost complete) expulsion of the whole of the accreted envelope, quenching the burning and the related supersoft source unusually early. The work of this mechanism in sustaining rapid mass loss has not been discussed at length since it was proposed by Orio et al. (1992), but it might indeed play a very important role in IP novae.
Acknowledgments
We acknowledge the anonymous referee for their careful reading and comments that significantly improved the manuscript. GJML is member of the CIC-CONICET (Argentina). AD was funded by the EU NextGenerationEU through the Recovery and Resilience Plan for Slovakia under the project No. 09I03-03-V04-00378. Some of the observations in the paper made use of the High-Resolution Imaging instrument Zorro. Zorro was funded by the NASA Exoplanet Exploration Program and built at the NASA Ames Research Center by Steve B. Howell, Nic Scott, Elliott P. Horch, and Emmett Quigley. Zorro was mounted on the Gemini South telescope of the international Gemini Observatory, a program of NSF NOIRLab, which is managed by the Association of Universities for Research in Astronomy (AURA) under a cooperative agreement with the U.S. National Science Foundation. on behalf of the Gemini partnership: the U.S. National Science Foundation (United States), National Research Council (Canada), Agencia Nacional de Investigación y Desarrollo (Chile), Ministério de Ciencia, Tecnología e Innovación (Argentina), Ministério da Ciência, Tecnologia, Inovações e Comunicações (Brazil), and Korea Astronomy and Space Science Institute (Republic of Korea). This paper uses observations made from the South African Astronomical Observatory (SAAO). This work is based on the research supported in part by the National Research Foundation of South Africa.
References
- Arras, P., Townsley, D. M., & Bildsten, L. 2006, ApJ, 643, L119 [Google Scholar]
- Astropy Collaboration (Robitaille, T. P., et al.) 2013, A&A, 558, A33 [NASA ADS] [CrossRef] [EDP Sciences] [Google Scholar]
- Astropy Collaboration (Price-Whelan, A. M., et al.) 2018, ApJ, 156, 123 [CrossRef] [Google Scholar]
- Astropy Collaboration (Price-Whelan, A. M., et al.) 2022, ApJ, 935, 167 [NASA ADS] [CrossRef] [Google Scholar]
- Bath, G. T., & Shaviv, G. 1976, MNRAS, 175, 305 [Google Scholar]
- Bradley, L., Sipőcz, B., Robitaille, T., et al. 2016, Photutils: Photometry tools [record ascl:1304.002] [Google Scholar]
- Kato, M., & Hachisu, I. 1989, ApJ, 346, 424 [Google Scholar]
- Kochanek, C. S., Shappee, B. J., Stanek, K. Z., et al. 2017, PASP, 129, 104502 [Google Scholar]
- König, O., Wilms, J., Arcodia, R., et al. 2022, Nature, 605, 248 [CrossRef] [Google Scholar]
- Leach, R., Hessman, F. V., King, A. R., Stehle, R., & Mattei, J. 1999, MNRAS, 305, 225 [Google Scholar]
- Mitrani, S., Behar, E., Drake, J. J., et al. 2024, ApJ, 970, 54 [Google Scholar]
- Murawski, G. 2019, The Astronomical Reports, IX, 33 [Google Scholar]
- Orio, M., Trussoni, E., & Oegelman, H. 1992, A&A, 257, 548 [Google Scholar]
- Orio, M., Gendreau, K., Giese, M., et al. 2022, ApJ, 932, 45 [NASA ADS] [CrossRef] [Google Scholar]
- Orio, M., Aydi, E., Shugarov, S., et al. 2024, ApJ, 963, 107 [NASA ADS] [CrossRef] [Google Scholar]
- Saio, H. 2013, in Eur. Phys. J. Web Conf., 43, 05005 [Google Scholar]
- Schaefer, B. E. 2022, MNRAS, 517, 3640 [Google Scholar]
- Shen, K. J., & Quataert, E. 2022, ApJ, 938, 31 [NASA ADS] [CrossRef] [Google Scholar]
- Sokolovsky, K. V., Li, K. L., Lopes de Oliveira, R., et al. 2022, MNRAS, 514, 2239 [Google Scholar]
- Starrfield, S., Iliadis, C., Timmes, F. X., et al. 2012a, Bull. Astron. Soc. India, 40, 419 [NASA ADS] [Google Scholar]
- Starrfield, S., Timmes, F. X., Iliadis, C., et al. 2012b, Balt. Astron., 21, 76 [NASA ADS] [Google Scholar]
- Szkody, P. 2021, Front. Astron. Space Sci., 8, 184 [Google Scholar]
- Warner, B. 2004, PASP, 116, 115 [NASA ADS] [CrossRef] [Google Scholar]
All Figures
|
Fig. 1. Multiwavelength long-term light curve of YZ Ret covering the period 2017-2026, starting in quiescence until the most recent observations. The panel shows the optical evolution from ASAS-SN. Vertical colored regions indicate the epochs of high-cadence TESS observations analyzed by Schaefer (2022) and in this work (TESS Sectors 3, 4, 29, 30, 31, 69, 96, and 97), X-ray observations from Swift, Chandra, and XMM-Newton, and high-speed ground-based photometry from GS/Zorro and SAAO. The light curve illustrates the transition from the post-outburst decline to the current VY Scl-type high state, providing the temporal context for the detected white dwarf spin. |
| In the text | |
|
Fig. 2. Top: Multi-instrument power spectrum analysis of YZ Ret. The plot compares the power spectra from GS, SAAO and TESS, each one normalized by their peak power for illustration purposes. The TESS data are shown both within its nominal sampling regime (black) and its reflected power beyond the Nyquist (dashed green line) frequency (gray), illustrating the P ≈ 42.61 s alias. All instruments consistently resolve a dominant coherent peak at f ≈ 0.02652 Hz (P ≈ 37.691 s), definitively identifying the white dwarf spin period and resolving sampling ambiguities. Moreover, although it was not significantly detected, two peaks on the side of the main peak in the TESS power spectrum have frequencies that are consistent with those arising from the beat between the spin and orbital periods, ω − Ω and ω + Ω. Bottom: Phase-folded optical light curves of YZ Ret normalized to the mean flux. Two phase cycles are shown for clarity, with the modulation maximum manually aligned at ϕ = 0.5. Solid lines represent the best-fit sinusoidal models for each dataset. The observed reduction in the TESS modulation amplitude relative to GS is fully consistent with the theoretical attenuation factor (≈0.59) derived from the finite integration time (sinc-function damping) being attributed to the undersampling of the 20 s cadence. |
| In the text | |
Current usage metrics show cumulative count of Article Views (full-text article views including HTML views, PDF and ePub downloads, according to the available data) and Abstracts Views on Vision4Press platform.
Data correspond to usage on the plateform after 2015. The current usage metrics is available 48-96 hours after online publication and is updated daily on week days.
Initial download of the metrics may take a while.