


Fig. 2.
Download original image
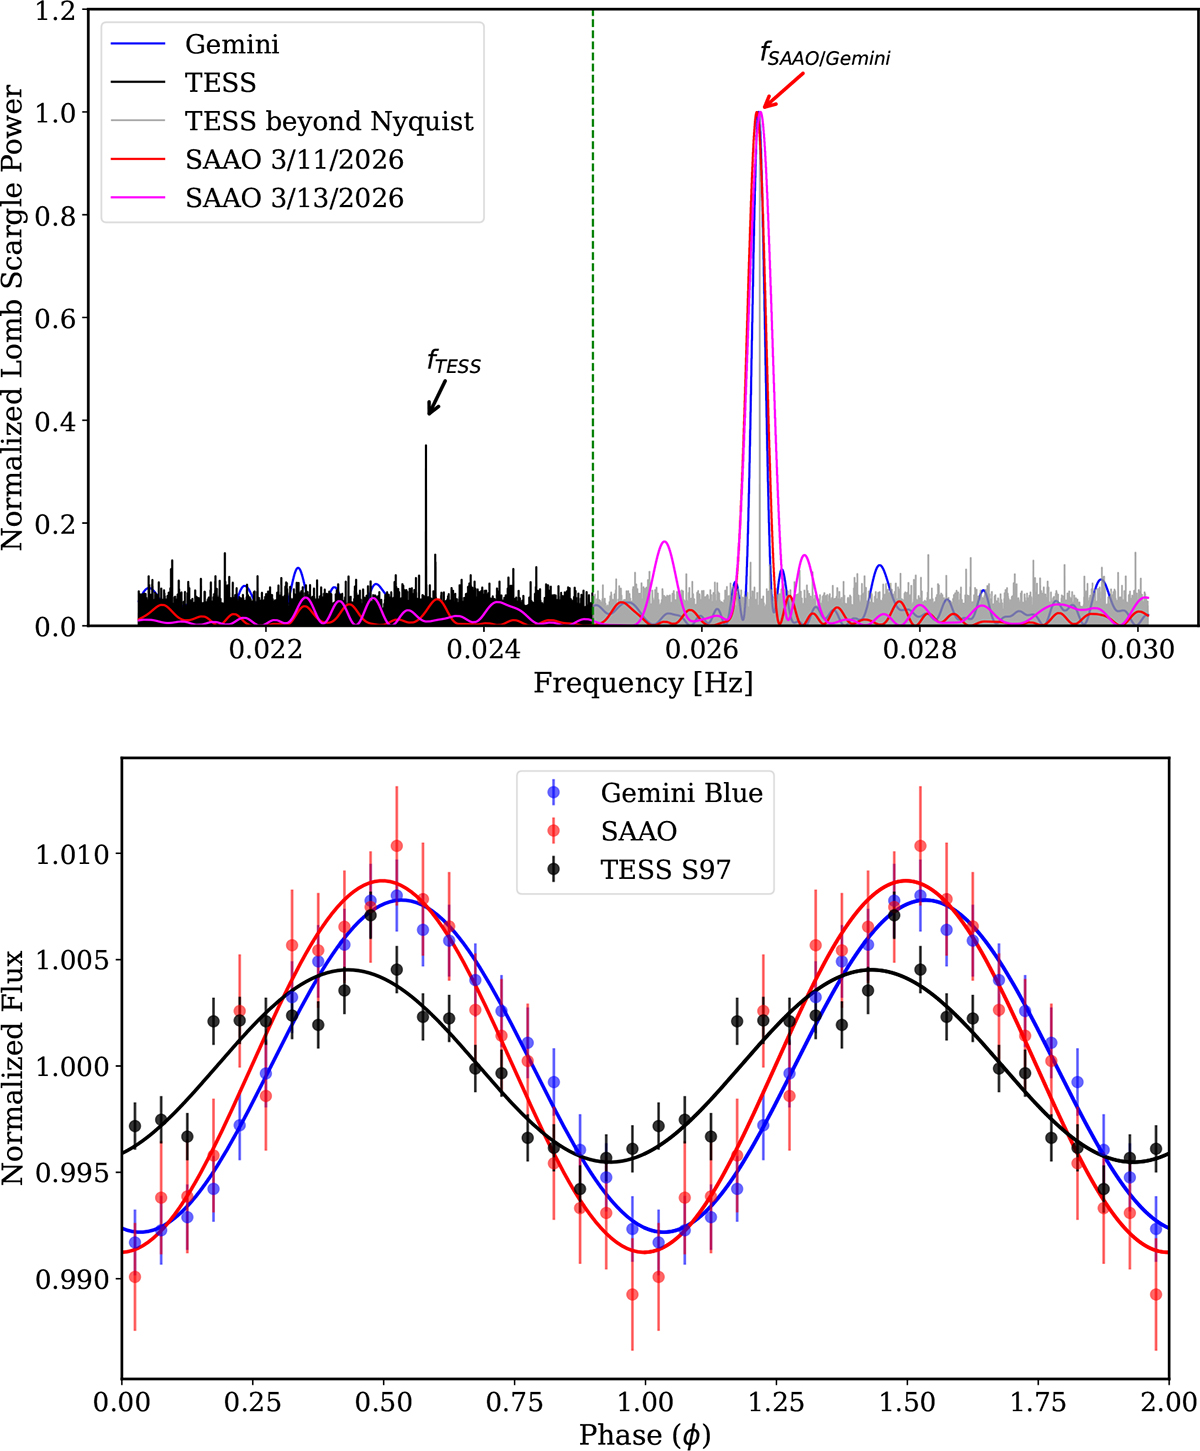
Top: Multi-instrument power spectrum analysis of YZ Ret. The plot compares the power spectra from GS, SAAO and TESS, each one normalized by their peak power for illustration purposes. The TESS data are shown both within its nominal sampling regime (black) and its reflected power beyond the Nyquist (dashed green line) frequency (gray), illustrating the P ≈ 42.61 s alias. All instruments consistently resolve a dominant coherent peak at f ≈ 0.02652 Hz (P ≈ 37.691 s), definitively identifying the white dwarf spin period and resolving sampling ambiguities. Moreover, although it was not significantly detected, two peaks on the side of the main peak in the TESS power spectrum have frequencies that are consistent with those arising from the beat between the spin and orbital periods, ω − Ω and ω + Ω. Bottom: Phase-folded optical light curves of YZ Ret normalized to the mean flux. Two phase cycles are shown for clarity, with the modulation maximum manually aligned at ϕ = 0.5. Solid lines represent the best-fit sinusoidal models for each dataset. The observed reduction in the TESS modulation amplitude relative to GS is fully consistent with the theoretical attenuation factor (≈0.59) derived from the finite integration time (sinc-function damping) being attributed to the undersampling of the 20 s cadence.
Current usage metrics show cumulative count of Article Views (full-text article views including HTML views, PDF and ePub downloads, according to the available data) and Abstracts Views on Vision4Press platform.
Data correspond to usage on the plateform after 2015. The current usage metrics is available 48-96 hours after online publication and is updated daily on week days.
Initial download of the metrics may take a while.