


Fig. 1.
Download original image
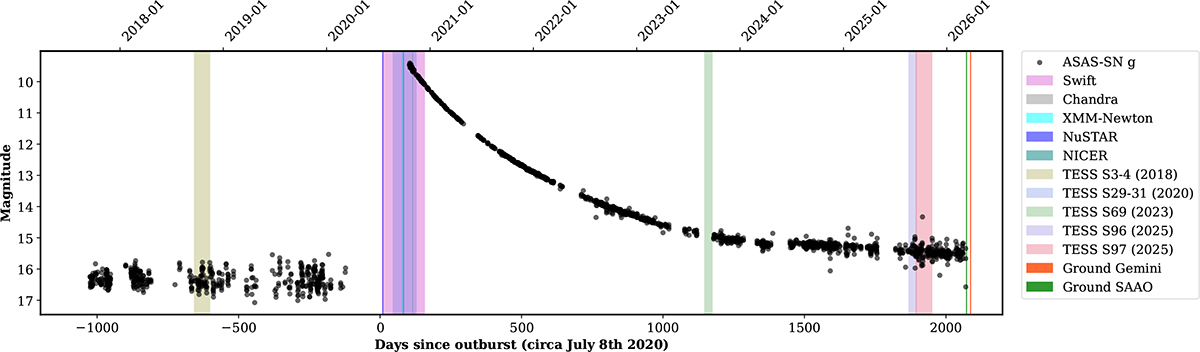
Multiwavelength long-term light curve of YZ Ret covering the period 2017-2026, starting in quiescence until the most recent observations. The panel shows the optical evolution from ASAS-SN. Vertical colored regions indicate the epochs of high-cadence TESS observations analyzed by Schaefer (2022) and in this work (TESS Sectors 3, 4, 29, 30, 31, 69, 96, and 97), X-ray observations from Swift, Chandra, and XMM-Newton, and high-speed ground-based photometry from GS/Zorro and SAAO. The light curve illustrates the transition from the post-outburst decline to the current VY Scl-type high state, providing the temporal context for the detected white dwarf spin.
Current usage metrics show cumulative count of Article Views (full-text article views including HTML views, PDF and ePub downloads, according to the available data) and Abstracts Views on Vision4Press platform.
Data correspond to usage on the plateform after 2015. The current usage metrics is available 48-96 hours after online publication and is updated daily on week days.
Initial download of the metrics may take a while.