


| Issue |
A&A
Volume 712, August 2026
|
|
|---|---|---|
| Article Number | L1 | |
| Number of page(s) | 10 | |
| Section | Letters to the Editor | |
| DOI | https://doi.org/10.1051/0004-6361/202660291 | |
| Published online | 30 July 2026 | |
Letter to the Editor
Discovery of EP J175257.3–351923 as a candidate black hole low-mass X-ray binary
1
Key Laboratory of Particle Astrophysics, Institute of High Energy Physics, Chinese Academy of Sciences, Beijing 100049, PR China
2
University of Chinese Academy of Sciences, Chinese Academy of Sciences, Beijing 100049, China
3
Université Paris Cité, CNRS, Astroparticule et Cosmologie, F-75013 Paris, France
4
Max Planck Institute for Extraterrestrial Physics, Garching 85748, Germany
5
School of Astronomy and Space Science, Nanjing University, Nanjing 210023, China
6
Key Laboratory of Modern Astronomy and Astrophysics (Nanjing University), Ministry of Education, Nanjing 210023, China
7
INAF-Osservatorio Astrofisico di Torino, Strada Osservatorio 20, I-10025 Pino Torinese, Italy
8
Sydney Institute for Astronomy, School of Physics A28, The University of Sydney, NSW 2006, Australia
9
Institute of Space Sciences (ICE, CSIC), Campus UAB, Carrer de Can Magrans s/n E-08193 Barcelona, Spain
10
Institut d’Estudis Espacials de Catalunya (IEEC), 08860 Castelldefels (Barcelona), Spain
11
IRAP, Université de Toulouse/OMP, CNRS, CNES, 9 avenue du Colonel Roche, BP 44346 F-31028 Toulouse Cedex 4, France
12
National Astronomical Observatories, Chinese Academy of Sciences, Beijing 100101, China
13
CEA Paris-Saclay, Institut de Recherche sur les lois Fondamentales de l’Univers, 9111 Gif-sur-Yvette, France
14
School of Science, Qingdao University of Technology, Qingdao 266525, China
15
Observatoire Astronomique de Strasbourg, Université de Strasbourg, CNRS, 11 rue de l’Université F-67000 Strasbourg, France
16
School of Physics and Astronomy, University of Southampton, Highfield Southampton SO17 1BJ, UK
17
Yunnan Observatory, Chinese Academy of Sciences, Kunming 650011, China
★ Corresponding author: This email address is being protected from spambots. You need JavaScript enabled to view it.
Received:
8
April
2026
Accepted:
20
June
2026
Abstract
We report the discovery of a new X-ray transient, EP J175257.3–351923 (EP250916a), by the Einstein Probe (EP) near the galactic plane. The outburst lasted for at least 250 days and reached a peak 2–10 keV flux of ∼4 × 10⁻¹⁰ erg cm−2 s−1, exhibiting a fast-rise exponential-decay (FRED) profile typical of X-ray binary outbursts. The source remained in the hard state throughout the outburst, with only modest variations in the photon index (∼1.6 − 2.2) and no evidence of a spectral state transition. Broadband spectral modeling suggests a truncated disk, a weak reflection component, and a high-energy cutoff at ∼217 keV, consistent with hard-state accretion in black-hole systems. No reliable optical or radio counterpart has been detected within the Swift/XRT error circle. The inferred X-ray-to-optical and X-ray-to-radio flux ratios are consistent with a low-mass X-ray binary (LMXB) classification. Neither pulsations nor significant aperiodic variability were detected. Although the compact object cannot yet be firmly identified, the timing, spectral, and multiwavelength evidence favors the classification of EP J175257.3–351923 as a black-hole (BH) LMXB candidate, highlighting EP’s potential to uncover a faint, previously hidden population of X-ray binaries.
Key words: accretion / accretion disks / black hole physics
© The Authors 2026
 Open Access article, published by EDP Sciences, under the terms of the Creative Commons Attribution License (https://creativecommons.org/licenses/by/4.0), which permits unrestricted use, distribution, and reproduction in any medium, provided the original work is properly cited.
This article is published in open access under the Subscribe to Open model. This email address is being protected from spambots. You need JavaScript enabled to view it. to support open access publication.
1. Introduction
X-ray binaries (XRBs) are binary systems composed of a compact object that is either a neutron star (NS) or a black hole (BH), along with a stellar companion. Most low-mass XRBs (LMXBs) are transient sources that remain predominantly in a quiescent state (Tanaka & Shibazaki 1996; Tetarenko et al. 2016). Episodically, these systems undergo X-ray outbursts lasting from weeks to months, likely driven by thermal-instability (Lasota 2001), typically reaching peak luminosities of LX ∼ 1037 − 1039 erg s−1 (Yan & Yu 2015; Tetarenko et al. 2016; Bahramian & Degenaar 2023). The discovery of these transients has relied on a series of wide-field X-ray monitors launched since the 1970s, including Ariel-V, Granat/WATCH, RXTE/ASM, INTEGRAL, Swift/BAT, and MAXI (e.g., Villa et al. 1976; Brandt et al. 1990; Levine et al. 1996; Winkler et al. 2003; Barthelmy et al. 2005; Matsuoka et al. 2009). However, such monitors often miss faint XRBs (peak luminosity of LX ∼ 1036 − 37 erg s−1) and the extreme cases of very faint XRBs (VFXBs; LX ∼ 1034 − 36 erg s−1; Wijnands et al. 2006). The low luminosities of these systems most likely arise from low mass-transfer rates, due to their small accretion disks, evaporation of the inner disk into a radiatively inefficient flow, or propeller effects in the case of NS systems (Bahramian & Degenaar 2022). The launch of the Einstein Probe (EP; Yuan et al. 2022, 2025) has greatly advanced the sensitivity of wide-field monitoring, enabling the detection of previously elusive faint sources and thereby providing insights into the low-luminosity accretion regime that has rarely been explored thus far.
Over its first two years of operation, EP has discovered more than a dozen faint XRB candidates, such as EP240809a (MAXI J1752–457; Liu et al. 2024 and Cheng et al., in prep.), EP240904a (EP J182730.0–095633; Cheng et al. 2025b), EP250315b (EP J163933.2–411414; Li et al. 2025 and Li et al. 2026), EP J174942.2–384834 (Coti Zelati et al. 2026), and EP250623a (EP J171159.4–333253; Wang et al. 2026 and Yang et al., in prep.). These detections demonstrate EP’s unique capacity to explore the previously unexplored population of faint XRBs.
Here, we report the discovery of a new faint XRB candidate, EP J175257.3–351923 (designated EP250916a), and present results from the follow-up observations. Section 2 describes the observations and data reduction. Section 3 presents the analysis and results, followed by our discussion and conclusions in Sect. 4.
2. Observations
EP J175257.3–351923 was first detected by the Wide-field X-ray Telescope (WXT) on board EP at 03:33:13 UTC on 2025 September 16 (Fig. 1; Wu et al. 2025; Dai et al. 2025a). EP/WXT continued monitoring this source until 2025 October 17, with typical exposures of ∼1–3 ks per epoch. Following a several-month-long interruption due to Sun-avoidance constraints, monitoring resumed on 2026 March 15. Multiwavelength follow-up observations (Table D.1) were performed with the EP/Follow-up X-ray Telescope (FXT; Chen et al. 2021), Space-based multiband astronomical Variable Objects Monitor (SVOM; Wei et al. 2016; Atteia et al. 2022), Neil Gehrels Swift Observatory (Swift; Gehrels et al. 2004), Nuclear Spectroscopic Telescope Array (NuSTAR; Harrison et al. 2013), and Gamma-Ray burst Optical Near-infrared Detector (GROND; Greiner et al. 2008). The source region was also covered by the Very Large Array Sky Survey (VLASS; Lacy et al. 2020) on 2026 February 1.
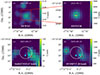 |
Fig. 1. Multiwavelength images of EP J175257.3–351923. (a) EP/WXT discovery image of the new transient. (b) EP/FXT-B follow-up image. The blue cross and yellow plus mark the EP/FXT and Swift/XRT positions, respectively. (c) Swift/UVOT V-band image. The white circle shows the Swift/XRT positional uncertainty (2.2″, 90%), red crosses mark three cataloged sources detected in both Gaia and VIRAC2/VVVX, and cyan stars indicate two additional sources listed only in VIRAC2/VVVX. (d) SVOM/VT B-band image, with the same symbols as in panel (c). All images have been smoothed for display purposes. |
The observation with EP/FXT (∼32 h post-discovery; ∼3.1 ks) detected a bright X-ray source within the EP/WXT error circle at RA (J2000) = 17h52m57.1s and Dec (J2000) = −35° 19′19.9″, with a 10″ uncertainty (90% confidence; Dai et al. 2025b). Swift/XRT further refined the position to RA (J2000) = 17h52m57.3s and Dec (J2000) = −35° 19′22.9″ (l = 355.3090°, b = −4.6086°), with a 2.2″ uncertainty at the 90% confidence (Illiano et al. 2025). We adopted the XRT position to search for the multiwavelength counterpart. Details of the data reduction are provided in Appendix A.
3. Analysis and results
3.1. Multiwavelength counterpart
As shown in the lower panels of Fig. 1 and in Fig. A.1, five cataloged optical/infrared sources are located within or near the Swift/XRT error circle. Three of these are recorded in both Gaia DR3 (Gaia Collaboration 2023) and VIRAC2/VVVX (Smith et al. 2025), while the remaining two are only cataloged in VIRAC2/VVVX. Photometry in this crowded field is challenging due to source confusion. We performed small-aperture photometry on the three Gaia sources using Swift Ultra-Violet/Optical Telescope (UVOT) data obtained during the outburst (see Appendix A for details). Although suboptimal, this approach allows us to examine whether the optical emission traces the X-ray variability. In contrast to the order-of-magnitude variability observed in X-rays, the optical fluxes of these sources vary by less than a factor of 1 during the outburst and show no evolutionary track comparable to that of the X-ray light curve. For the GROND data, reliable photometry is not feasible due to crowding. These sources are therefore likely chance alignments with the EP source, although a true counterpart cannot be fully excluded.
To constrain the optical emission from the EP source, we derived upper limits at the XRT position instead (see Appendix A). Aperture photometry performed at the Swift/XRT error circle yielded 3σ upper limits of V > 17.77 mag from Swift/UVOT (ObsID: 03000100002) on September 17 and B > 18.71 mag from the SVOM Visible Telescope (VT; ObsID: 06333) on September 18. We also searched the VLASS quick-look image without detecting a radio counterpart within the XRT error circle, deriving a 3σ upper limit of 4.44 × 10⁻⁴ Jy beam−1 at 3 GHz (Appendix A.6).
3.2. X-ray spectral analysis
The X-ray spectral analysis was performed with XSPEC v12.14.0b (Arnaud 1996) using data from EP/WXT (0.5–4.0 keV), EP/FXT (0.5–10 keV), Swift/XRT (0.3–10 keV), SVOM Microchannel X-ray Telescope (MXT; 0.4–10 keV), and NuSTAR (4–78 keV). Interstellar absorption was modeled with tbabs adopting the solar abundances of Wilms et al. (2000), and a cross-calibration constant was included in joint fits. Unabsorbed X-ray fluxes were estimated using the cflux convolution model. The details of the spectral fitting are given in Appendix B.
3.3. Long-term X-ray evolution
The long-term evolution of the flux is shown in Fig. 2. Archival EP/WXT observations performed on 2025 September 14 and 15 yield a pre-outburst unabsorbed 2 − 10 keV flux upper limit of ∼4 × 10⁻¹¹ erg cm−2 s−1. Following the onset of the outburst at MJD 60934 (2025 September 16), the source exhibited a rapid flux increase, peaking at ∼MJD 60936 (2025 September 18), after which the emission entered a gradual decay phase. The X-ray light curve is well described by a fast-rise exponential-decay (FRED) profile, characterized by a rise timescale of ∼2.5 days and a decay timescale of ∼15.7 days (see Appendix C.1).
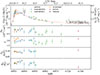 |
Fig. 2. Long-term X-ray evolution: unabsorbed 2–10 keV flux/luminosity, hydrogen column density (NH), power-law index (Γ), inner disk temperature (Tin), and inner disk radius (Rin). Open symbols indicate fixed diskbb values. Different symbols correspond to different instruments. The solid red line represents the best-fitting FRED model (excluding the pre-outburst EP/WXT upper limit). Luminosity and Rin are calculated assuming D = 8 kpc, M = 10 M⊙, and i = 58° (Table D.2). |
The Γ remained within ∼1.6–2.2 throughout the outburst, with no clear evidence of spectral softening. To further investigate the state evolution during the outburst, we constructed a hardness–intensity diagram (HID; Fig. 3). Hardness is defined as the ratio of unabsorbed fluxes in the 4–10 keV and 2–4 keV bands, and intensity as the unabsorbed flux in the 2–10 keV band. The HID indicates that the source remained in the hard state, with no evidence of a state transition.
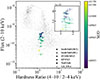 |
Fig. 3. HID during the outburst. EP/WXT data are excluded due to the narrow energy band. The inset shows a zoomed-in view. Faint gray points show long-term MAXI data of GX 339–4 (“q”-like tracks of “successful” outbursts are evident) for comparison. |
The NH ranges from 4 × 10²¹ to 9 × 1021 cm−2 during the outburst, showing no significant evolution within the uncertainties. The NH values exceed the Galactic H I column density of ∼2 × 1021 cm−2 from the HI4PI survey (HI4PI Collaboration 2016)1, hinting at potential intrinsic absorption. However, given the uncertainties in the HI4PI Galactic estimate, this apparent excess may instead stem from differential reddening in the Galactic bulge.
3.4. Timing analysis
We inspected all available X-ray light curves and found no evidence of Type-I bursts. Average power spectral densities (PSDs) were computed using stingray v2.3.2 (Huppenkothen et al. 2019; Bachetti et al. 2024), based on 512 s segments from 0.005 s barycenter-corrected light curves of EP/FXT-B, Swift/XRT (WT mode), SVOM/MXT, and NuSTAR. No significant coherent pulsations, quasi-periodic oscillations (QPOs), or red noise were detected, whereas the higher signal-to-noise XMM-Newton observation revealed a weak QPO at a frequency of ∼13 Hz (Jaisawal et al. 2026). The averaged power spectra (fractional-rms normalization; Fig. D.2) from NuSTAR gave a 99% upper limit of 10.3% on the integrated rms over 0.1–64 Hz. An acceleration search using PRESTO (Ransom 2011) found no significant pulsations, implying a 99% upper limit of ∼6–7% on the pulsed fraction.
4. Discussion and conclusions
We report the discovery of a new long-duration X-ray transient, EP J175257.3–351923, located at a Galactic latitude of b = −4.6086°, close to the Galactic plane where the space density of XRBs reaches its maximum (Grimm et al. 2002; Bahramian & Degenaar 2023). The source exhibits characteristics analogous to those of XRBs. Its long-term X-ray light curve exhibits a characteristic FRED morphology, a hallmark of transient XRB outbursts (Chen et al. 1997; Remillard & McClintock 2006). The outburst persists for at least ∼250 days, well within the typical duration range observed in Galactic XRB transients (Tetarenko et al. 2016; Heinke et al. 2025). The source maintains a remarkable spectral stability throughout the outburst, remaining in the hard state with only limited variation in photon index. Such behavior is commonly referred to as a “failed outburst” and has been reported in hard-state outbursts of XRBs (Tetarenko et al. 2016; Yan & Yu 2015). Furthermore, broadband spectral modeling suggests a truncated accretion disk together with a reflection component, with a photon index of Γ ∼ 1.6–2.2 and a high-energy cutoff at ∼217 keV, broadly consistent with the canonical hard-state characteristics of XRBs (Done et al. 2007; Bu & Zhang 2023).
No reliable optical or radio counterpart was detected within the Swift/XRT localization region in the available Swift/UVOT, SVOM/VT, GROND, and VLASS images. The optical non-detection is likely due to the combined effects of strong interstellar extinction, weak optical brightening associated with the faint X-ray outburst, and source confusion in the crowded Galactic-plane environment. The radio non-detection may also reflects weak emission from the faint outburst. Assuming a representative distance of 8 kpc and a reddening of E(B − V) = 0.40 mag (Wang et al. 2025), we derived a 3σ upper limit on the de-reddened B-band magnitude, B0 ≳ 18.58 mag (using the extinction law of Cardelli et al. 1989). Using quasi-simultaneous X-ray and optical data, we derived a lower limit on the X-ray-to-optical flux ratio, defined as ξ = B0 + 2.5 log FX, yielding ξ ≳ 21.75. This is consistent with values typically observed in LMXBs (Lewin et al. 1995). Furthermore, assuming a distance of 8 kpc, both the X-ray-to-optical and X-ray-to-radio luminosity ratios display a broad agreement with the hard-state LMXB correlations (see Figs. D.3 and D.4; Russell et al. 2006; Bahramian & Rushton 2022). Collectively, the temporal, spectral, and multiwavelength properties favor the classification of this source as a LMXB candidate, which is consistent with the findings of Jaisawal et al. (2026).
EP J175257.3–351923, with an X-ray luminosity of the order of ∼1036 erg s−1, can be classified as a faint or VFXB candidate according to Wijnands et al. (2006). In particular, in many VFXBs the companions are expected to be intrinsically faint (e.g., low-mass main-sequence stars). The multiwavelength correlations observed for EP J175257.3–351923 are consistent with this scenario. Moreover, the long-term light-curve morphology, and photon-index evolution of this EP source resemble those of VFXBs such as EP J182730.0−095633 (Cheng et al. 2025b) and IGR J17285−2922 (Stoop et al. 2021), both of which have been proposed as BH candidates. Interestingly, a stable QPO at ∼40 mHz with a fractional rms amplitude of ∼20–30% has been detected in EP J182730.0−095633. In contrast, we do not detect any significant QPO in EP J175257.3–351923; the PSD is largely featureless. Nevertheless, featureless PSDs have also been reported in several VFXBs (Koch et al. 2014; van den Eijnden et al. 2018; Marino et al. 2022). Furthermore, the presence of a truncated accretion disk and a reflection component is in good agreement with the properties reported for the VFXBs IGR J17062–6143 and MAXI J1848–015 (van den Eijnden et al. 2018; Pike et al. 2022).
Based on the FRED modeling, the decay timescale of ∼15.7 days implies an outer disk radius of ∼104 Rg (Appendix C.2). Assuming this radius is comparable to the circularization radius, we derived an estimated orbital period of ∼4.3 h. Although these estimates are subject to considerable uncertainties arising from both the model assumptions and the choice of system parameters, this source is likely a short-period system with a relatively small accretion disk. An analogous example is Swift J1357.2−0933, a short-period (P ≈ 3 h) BH XRB transient in the VFXB regime (Mata Sánchez et al. 2015). Such short-period systems represent a proposed channel for the formation of VFXBs (Heinke et al. 2015).
Regarding the nature of the compact object, the absence of coherent pulsations, Type-I X-ray bursts, and dynamical mass measurements leaves both NS and BH interpretations viable. However, the high cut-off energy of ∼217 keV inferred from spectral modeling favors a BH system (Burke et al. 2017). This is because seed photons from an NS surface and boundary layer enhance Compton cooling, generally leading to lower cut-off energies, whereas the absence of a solid surface in BHs allows for deeper gravitational energy release and higher electron temperatures (Burke et al. 2017; Pszota 2024).
Aside from an XRB classification, alternative interpretations such as a classical nova or a tidal disruption event (TDE) appear less likely. Classical novae are typically associated with prominent supersoft X-ray emission (Chomiuk et al. 2021), which is absent in this source. Thermal TDEs generally exhibit soft X-ray spectra (Mummery et al. 2023), whereas the X-ray spectrum of this EP source remains persistently hard. Moreover, unlike jetted TDEs such as Swift J1644+57 (Mimica et al. 2015) and AT2022cmc (Rhodes et al. 2023), which display bright radio emission detectable for months to years, no radio counterpart is found in the VLASS images at the position of this source, further disfavoring the TDE interpretation.
Overall, future multiwavelength observations, particularly with large-aperture optical telescopes, will be essential to further constrain the nature of the compact object and to fully characterize the physical properties of this system. Nevertheless, this source provides an interesting case for understanding weak outbursts, while demonstrating EP’s capacity to discover faint XRBs.
Acknowledgments
We thank the anonymous referee for comments that helped improve the paper. This work made use of data from EP, SVOM, NuSTAR, and Swift. This work was supported by the National Key R&D Program of China (Nos. 2025YFF0511102 and 2021YFA0718500), the National Natural Science Foundation of China (Nos. 12122306, 12025301, and 12103027), the Strategic Priority Research Program of the Chinese Academy of Sciences, and China’s Space Origins Exploration Program. SG acknowledges the support of the CNES. F.C.Z. is supported by the Ramón y Cajal fellowship (RYC2021-030888-I), Spanish grant ID2023-153099NA-I00, and the program Unidad de Excelencia Maria de Maeztu CEX2020-001058-M. Part of the funding for GROND (both hardware and personnel) was generously granted by the Leibniz-Prize to G. Hasinger (DFG grant HA 1850/28-1) and by the Thüringer Landessternwarte Tautenburg. Y. F. H. also acknowledges the support from the Xinjiang Tianchi Program.
References
- Arnaud, K. A. 1996, ASP Conf. Ser., 101, 17 [Google Scholar]
- Atteia, J.-L., Cordier, B., & Wei, J. 2022, Int. J. Mod. Phys. D, 31, 2230008 [NASA ADS] [CrossRef] [Google Scholar]
- Bachetti, M., Huppenkothen, D., Stevens, A., et al. 2024, J. Open Source Softw., 9, 7389 [Google Scholar]
- Bahramian, A., & Degenaar, N. 2022, in Low-Mass X-ray Binaries, eds. C. Bambi, & A. Santangelo (Singapore: Springer Nature Singapore), 1 [Google Scholar]
- Bahramian, A., & Degenaar, N. 2023, in Handbook of X-ray and Gamma-ray Astrophysics, 120 [Google Scholar]
- Bahramian, A., & Rushton, A. 2022, https://doi.org/10.5281/zenodo.7059313 [Google Scholar]
- Barthelmy, S. D., Barbier, L. M., Cummings, J. R., et al. 2005, Space Sci. Rev., 120, 143 [Google Scholar]
- Blanton, M. R., & Roweis, S. 2007, AJ, 133, 734 [NASA ADS] [CrossRef] [Google Scholar]
- Brandt, S., Lund, N., & Rao, A. R. 1990, Adv. Space Res., 10, 239 [Google Scholar]
- Bu, Q., & Zhang, S. 2023, in Handbook of X-ray and Gamma-ray Astrophysics, 139 [Google Scholar]
- Burke, M. J., Gilfanov, M., & Sunyaev, R. 2017, MNRAS, 466, 194 [Google Scholar]
- Cardelli, J. A., Clayton, G. C., & Mathis, J. S. 1989, ApJ, 345, 245 [Google Scholar]
- Cash, W. 1979, ApJ, 228, 939 [Google Scholar]
- Chen, W., Shrader, C. R., & Livio, M. 1997, ApJ, 491, 312 [NASA ADS] [CrossRef] [Google Scholar]
- Chen, Y., Cui, W., Han, D., et al. 2021, SPIE Conf. Ser., 11444, 114445B [Google Scholar]
- Cheng, H., Zhang, C., Ling, Z., et al. 2025a, Exp. Astron., 60, 15 [Google Scholar]
- Cheng, H. Q., Zhao, Q. C., Tao, L., et al. 2025b, ApJ, 991, L41 [Google Scholar]
- Chomiuk, L., Metzger, B. D., & Shen, K. J. 2021, ARA&A, 59, 391 [NASA ADS] [CrossRef] [Google Scholar]
- Coti Zelati, F., Marino, A., Wang, Y. L., et al. 2026, ApJ, 1003, 224 [Google Scholar]
- Dai, C. Y., Wu, Q. Y., Li, D. Y., & Pan, H. W. 2025a, ATel, 17395, 1 [Google Scholar]
- Dai, C. Y., Wu, Q. Y., Li, D. Y., Pan, H. W., & Einstein Probe Team 2025b, GCN, 41861, 1 [Google Scholar]
- Dauser, T., Garcia, J., Wilms, J., et al. 2013, MNRAS, 430, 1694 [Google Scholar]
- Done, C., Gierliński, M., & Kubota, A. 2007, A&ARv, 15, 1 [Google Scholar]
- Evans, P. A., Beardmore, A. P., Page, K. L., et al. 2009, MNRAS, 397, 1177 [Google Scholar]
- Frank, J., King, A., & Raine, D. 1992, Camb. Astrophys. Ser., 21 [Google Scholar]
- Gaia Collaboration (Vallenari, A., et al.) 2023, A&A, 674, A1 [NASA ADS] [CrossRef] [EDP Sciences] [Google Scholar]
- García, J., Dauser, T., Lohfink, A., et al. 2014, ApJ, 782, 76 [Google Scholar]
- Gehrels, N., Chincarini, G., Giommi, P., et al. 2004, ApJ, 611, 1005 [Google Scholar]
- Götz, D., Crepaldi, S., Doumayrou, E., et al. 2026, Res. Astron. Astrophys., in press [Google Scholar]
- Greiner, J., Bornemann, W., Clemens, C., et al. 2008, PASP, 120, 405 [Google Scholar]
- Grimm, H. J., Gilfanov, M., & Sunyaev, R. 2002, A&A, 391, 923 [NASA ADS] [CrossRef] [EDP Sciences] [Google Scholar]
- Harrison, F. A., Craig, W. W., Christensen, F. E., et al. 2013, ApJ, 770, 103 [Google Scholar]
- Heinke, C. O., Bahramian, A., Degenaar, N., & Wijnands, R. 2015, MNRAS, 447, 3034 [NASA ADS] [CrossRef] [Google Scholar]
- Heinke, C. O., Zheng, J., Maccarone, T. J., et al. 2025, ApJS, 279, 57 [Google Scholar]
- HI4PI Collaboration (Ben Bekhti, N., et al.) 2016, A&A, 594, A116 [NASA ADS] [CrossRef] [EDP Sciences] [Google Scholar]
- Huppenkothen, D., Bachetti, M., Stevens, A. L., et al. 2019, ApJ, 881, 39 [Google Scholar]
- Illiano, G., Zanon, A. M., Sbarufatti, B., et al. 2025, ATel, 17397, 1 [Google Scholar]
- Jaisawal, G. K., Illiano, G., Carotenuto, F., et al. 2026, ApJ, in press [Google Scholar]
- Koch, E. W., Bahramian, A., Heinke, C. O., et al. 2014, MNRAS, 442, 372 [NASA ADS] [CrossRef] [Google Scholar]
- Krühler, T., Küpcü Yoldas, A., Greiner, J., et al. 2008, ApJ, 685, 376 [CrossRef] [Google Scholar]
- Lacy, M., Baum, S. A., Chandler, C. J., et al. 2020, PASP, 132, 035001 [Google Scholar]
- Lasota, J.-P. 2001, New Astron. Rev., 45, 449 [Google Scholar]
- Levine, A. M., Bradt, H., Cui, W., et al. 1996, ApJ, 469, L33 [NASA ADS] [CrossRef] [Google Scholar]
- Lewin, W. H. G., van Paradijs, J., & van den Heuvel, E. P. J. 1995, in X-ray Binaries (Cambridge, MA: Cambridge University Press) [Google Scholar]
- Li, D. Y., Shui, Q. C., Huang, M. Q., Liu, Y., & Yuan, W. 2025, ATel, 17083, 1 [Google Scholar]
- Li, P., Tao, L., Soria, R., et al. 2026, ApJ, submitted [Google Scholar]
- Liu, H. Y., Yang, H. N., Li, D. Y., et al. 2024, ATel, 16765, 1 [Google Scholar]
- Maggi, P., Michel, L., Götz, D., et al. 2026, Res. Astron. Astrophys., in press [Google Scholar]
- Marino, A., Anitra, A., Mazzola, S. M., et al. 2022, MNRAS, 515, 3838 [CrossRef] [Google Scholar]
- Mata Sánchez, D., Muñoz-Darias, T., Casares, J., Corral-Santana, J. M., & Shahbaz, T. 2015, MNRAS, 454, 2199 [CrossRef] [Google Scholar]
- Matsuoka, M., Kawasaki, K., Ueno, S., et al. 2009, PASJ, 61, 999 [Google Scholar]
- Mimica, P., Giannios, D., Metzger, B. D., & Aloy, M. A. 2015, MNRAS, 450, 2824 [NASA ADS] [CrossRef] [Google Scholar]
- Mummery, A., Wevers, T., Saxton, R., & Pasham, D. 2023, MNRAS, 519, 5828 [NASA ADS] [CrossRef] [Google Scholar]
- Pike, S. N., Negoro, H., Tomsick, J. A., et al. 2022, ApJ, 927, 190 [Google Scholar]
- Powell, C. R., Haswell, C. A., & Falanga, M. 2007, MNRAS, 374, 466 [Google Scholar]
- Pszota, G. 2024, Universe, 10, 446 [Google Scholar]
- Ransom, S. 2011, Astrophysics Source Code Library [record ascl:1107.017] [Google Scholar]
- Remillard, R. A., & McClintock, J. E. 2006, ARA&A, 44, 49 [Google Scholar]
- Rhodes, L., Bright, J. S., Fender, R., et al. 2023, MNRAS, 521, 389 [Google Scholar]
- Riello, M., De Angeli, F., Evans, D. W., et al. 2021, A&A, 649, A3 [NASA ADS] [CrossRef] [EDP Sciences] [Google Scholar]
- Russell, D. M., Fender, R. P., Hynes, R. I., et al. 2006, MNRAS, 371, 1334 [NASA ADS] [CrossRef] [Google Scholar]
- Smith, L. C., Lucas, P. W., Koposov, S. E., et al. 2025, MNRAS, 536, 3707 [NASA ADS] [CrossRef] [Google Scholar]
- Stoop, M., van den Eijnden, J., Degenaar, N., et al. 2021, MNRAS, 507, 330 [NASA ADS] [CrossRef] [Google Scholar]
- Tanaka, Y., & Shibazaki, N. 1996, ARA&A, 34, 607 [NASA ADS] [CrossRef] [Google Scholar]
- Tetarenko, B. E., Sivakoff, G. R., Heinke, C. O., & Gladstone, J. C. 2016, ApJS, 222, 15 [Google Scholar]
- van den Eijnden, J., Degenaar, N., Pinto, C., et al. 2018, MNRAS, 475, 2027 [Google Scholar]
- Villa, G., Page, C. G., Turner, M. J. L., et al. 1976, MNRAS, 176, 609 [NASA ADS] [CrossRef] [Google Scholar]
- Wang, T., Yuan, H., Chen, B., et al. 2025, ApJS, 280, 15 [Google Scholar]
- Wang, Y. L., Coti Zelati, F., Parent, E., et al. 2026, ApJ, 1003, 22 [Google Scholar]
- Wei, J., Cordier, B., Antier, S., et al. 2016, arXiv e-prints [arXiv:1610.06892] [Google Scholar]
- Wijnands, R., in’t Zand, J. J. M., Rupen, M., et al. 2006, A&A, 449, 1117 [NASA ADS] [CrossRef] [EDP Sciences] [Google Scholar]
- Wilms, J., Allen, A., & McCray, R. 2000, ApJ, 542, 914 [Google Scholar]
- Winkler, C., Courvoisier, T. J. L., Di Cocco, G., et al. 2003, A&A, 411, L1 [NASA ADS] [CrossRef] [EDP Sciences] [Google Scholar]
- Wu, Q. Y., Dai, C. Y., Li, D. Y., Pan, H. W., & Einstein Probe Team 2025, GCN, 41841, 1 [Google Scholar]
- Yan, Z., & Yu, W. 2015, ApJ, 805, 87 [NASA ADS] [CrossRef] [Google Scholar]
- Yao, Z. H., Qiu, Y., Deng, J. S., et al. 2026, Res. Astron. Astrophys., accepted [Google Scholar]
- Yuan, W., Zhang, C., Chen, Y., & Ling, Z. 2022, in Handbook of X-ray and Gamma-ray Astrophysics, eds. C. Bambi, & A. Sangangelo, 86 [Google Scholar]
- Yuan, W., Dai, L., Feng, H., et al. 2025, Sci. China: Phys. Mech. Astron., 68, 239501 [Google Scholar]
Appendix A: Data reduction
A.1. EP
To provide full coverage of the outburst, in addition to the follow-up observations (Table D.1), we also use survey data from EP/WXT. The WXT spectra were extracted using the standard wxtpipeline pipeline (Liu et al., in prep.) and the latest calibration database (CALDB), which is based on results from ground calibration experiments (Cheng et al. 2025a). Due to the limited photon statistics of the WXT data, the spectra were grouped to a minimum of one count per bin using grppha in HEASoft v6.34, and spectral fitting was performed using the Cash statistic (C–stat; Cash 1979).
Owing to solar angle constraints, EP/FXT observations were carried out on 2025 September 17 (upper-right panel of Fig. 1) and on 2026 April 22. For the first observation, we analyzed only the FXT module B (FXT-B) data taken in partial window (PW) mode with the fxtchain tool, as the module A (FXT-A) operating in full frame (FF) mode was affected by severe pile-up. Both PW and FF mode data were used for the second observation. Source and background spectra were extracted from a circular region with a radius of 90″ and from an annulus spanning 150″–240″ centered on the source position, respectively. The spectra were grouped to a minimum of 25 counts per bin using grppha.
A.2. NuSTAR
NuSTAR observed this source on 2025 September 24 (ObsID 91101336002; ∼21 ks). Data were processed with nupipeline and CALDB version 20250922. Source events were extracted from a circular region of 60″ radius centered on the source, and background events were extracted from a rectangular region free of stray light and sufficiently distant from the source. The spectra, light curves, and response files were produced using nuproducts, and the spectra were grouped to a minimum of 25 counts per bin.
A.3. Swift
Swift/XRT performed high-cadence monitoring of EP J175257.3–351923 starting on 2025 September 17 and continuing for approximately one month, with a total of 21 observations. The spectra were extracted using the online tool provided by Evans et al. (2009)2. For spectra with more than 1500 total counts, the data were binned to ≥25 counts per bin and fitted using χ2 statistics. For spectra with fewer counts, the data were grouped to a minimum of one count per bin and fitted using Cash statistic.
The UVOT monitored the source contemporaneously with XRT. Some observations were performed only in the V band, while others included both the B and V bands. We analyzed the Level 3 data products.
For potential optical counterparts (see Sect. 3.1), aperture photometry was performed using uvotsource with a 1″ aperture and a nearby background region of 5″ radius free of sources. While this small aperture is suboptimal for absolute photometry, it was chosen to minimize contamination from the crowded stellar field. As our analysis focuses on the evolution of optical flux during the outburst for counterpart identification, uncertainties in the aperture correction do not affect the observed trends. To estimate the upper limit of the optical emission from EP J175257.3–351923, an aperture of 2.2″ (corresponding to the Swift/XRT localization uncertainty) and a circular background of 5″ radius were used. We note that with an aperture of 2.2″, emission from nearby sources is included, yielding an overestimated upper limit, though this does not affect the constraints on the companion type based on the X-ray-to-optical flux ratio (Sec. 4). Aperture corrections were applied using the apercorr=CURVEOFGROWTH option. All magnitudes reported in this work are given in the Vegamag system.
Aperture photometry of the three Gaia sources within or near the Swift/XRT error circle using Swift/UVOT data gives averaged magnitudes of V = 18.19, 18.46, and 18.16 mag over the outburst, broadly consistent with the V-band magnitudes (V = 17.70, 18.91, and 18.10 mag) derived from Gaia DR3 using the relation of Riello et al. (2021). However, we need to point out that the small aperture used may introduce systematic uncertainties in the magnitudes.
A.4. SVOM
SVOM conducted five follow-up observations between 2025 September 17 and 21, before the source became inaccessible owing to solar constraints. The VT data from September 17 were lost due to telemetry failures.
The MXT (Götz et al. 2026) on board SVOM observed the source during this period. The event-mode data were processed with version 1.13 of the MXT pipeline (Maggi et al. 2026). Source detection was performed via point-spread function fitting, and the pipeline was used to extract the source and background spectra, along with the associated response files, from the event lists. Owing to the relatively high background of the MXT data, the spectra were grouped to a minimum of one count per bin using grppha and analyzed with the C–stat.
The VT on board SVOM also observed the source region contemporaneously with WXT, with an exposure time of 70 s per frame. Level 2 data products, including dark and flat-field corrections, were used. Aperture photometry was performed using photutils in Python, with aperture corrections applied. The source aperture sizes and background regions adopted for nearby Gaia sources and for estimating the upper limit of the optical emission from EP J175257.3–351923 are identical to those used for Swift/UVOT. The magnitudes were first converted to the Johnson B-band AB system following Yao et al. (2026), and subsequently transformed to the Vegamag system using the relation of Blanton & Roweis (2007).
The ECLAIRs data were also examined, but the source was not detected.
A.5. GROND
This source was observed with the GROND mounted on the MPG 2.2 m telescope at ESO’s La Silla Observatory. Observations were carried out simultaneously in the g′, r′, and i′ bands, as well as in the H and Ks bands, on 2025 September 17 at 01:02 UT, September 18 at 23:55 UT, and September 27 at 01:12 UT. The total exposure times were 33 min in the optical and 30 min in the near-infrared. The data were reduced using the standard IRAF-based GROND pipeline (Krühler et al. 2008).
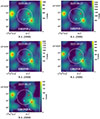 |
Fig. A.1. GROND observations on 2025 September 17. The images have been smoothed for display purposes. Symbols follow the same convention as in Fig. 1. |
A.6. VLASS
The source position was covered by VLASS on 2026 February 1. No radio counterpart is detected within the XRT error circle in the VLASS quick-look image. The local rms noise was measured within a circular region of radius 20″ centered on the XRT position, yielding a 3σ flux density upper limit of 4.44 × 10⁻⁴ Jy beam−1 at 3 GHz.
Appendix B: Details of X-ray spectral fitting
B.1. Swift/XRT and EP/FXT
Between 2025 September 17 and October 8, the Swift/XRT WT-mode spectra require an absorbed power-law plus diskbb model (simftest proves the diskbb addition is statistically significant, p < 0.01). For the Swift/XRT PC-mode spectra, the diskbb parameters could not be constrained because of limited photon statistics after excluding central pixels to mitigate pile-up. They were therefore fixed to the values derived from temporally adjacent WT-mode observations. After October 8, a single absorbed power-law is sufficient. For the two EP/FXT observations, the spectra are best fitted with an absorbed power-law plus diskbb model.
B.2. SVOM/MXT
The SVOM/MXT spectra alone do not require an additional thermal component and are adequately described by a single absorbed power-law model. For consistency with the Swift/XRT and EP/FXT spectral analysis, we nevertheless adopted the same absorbed power-law plus diskbb model when fitting the MXT spectra. However, when the diskbb parameters were fixed to the values derived from adjacent Swift/XRT observations, the inferred power-law photon index became significantly softer. This behavior indicates a degeneracy between the thermal and non-thermal components within the MXT bandpass. We caution that the MXT-derived photon index should be interpreted cautiously due to these degeneracies.
B.3. EP/WXT
For the EP/WXT spectra during the outburst, the narrow energy coverage and limited photon statistics allowed only an absorbed power-law fit, with NH fixed to the value derived from the adjacent EP/FXT observations and Γ fixed at 2.
To derive the pre-outburst flux upper limit, we combined the three WXT observations covering this position obtained on 2025 September 14 and 15, yielding a total exposure time of ∼6400 s. The source region was defined as a circle centered on the Swift/XRT position with a radius of 9.2 ′, while the background was extracted from a nearby source-free region with a radius of 30 ′. The 90% upper limit on the count rate was converted to an unabsorbed flux upper limit using the count-rate-to-flux conversion factor, assuming an absorbed power-law model with NH derived from the first EP/FXT observation and Γ = 2.
B.4. Joint NuSTAR and Swift spectral fitting
The NuSTAR spectra obtained on 2025 September 24 were fitted jointly with two quasi-simultaneous Swift/XRT observations taken on September 23 and 26 to improve soft-band photon statistics. An absorbed cutoff power-law improves the fit over a simple power-law, reducing χ2/d.o.f. from 2158/1669 to 2093/1668, yielding a cutoff energy of  keV. However, the cutoff power-law model still leaves soft X-ray residuals and a weak broad hump at 20–40 keV (Fig. D.1), suggesting the presence of additional disk and reflection components. Consequently, we used constant*tbabs*(cutoffpl+relxill+diskbb) to fit the spectra, where relxill is a model for relativistic reflection on an accretion disk (Dauser et al. 2013; García et al. 2014). As several parameters of relxill could not be well constrained, we fixed the BH spin (a) at 0.998, the inner disk radius (Rin) at 100 Rg (as suggested by the long-term evolution of the diskbb parameters; Fig. 2), and the emissivity indices (q1 and q2) at 3, with the reflection fraction fixed at −1 so that relxill accounts only for the reflected component. This model provided a good fit with χ2/d.o.f. = 1853/1662, with the best-fit parameters listed in Table D.2, yielding a cutoff energy of
  keV and an inclination angle of
  .
.
Appendix C: Long-term light-curve modeling and binary constraints
C.1. FRED modeling
We fit the multi-instrument long-term X-ray light curve, excluding the pre-outburst upper limits, using a modified FRED model (Powell et al. 2007) parameterized as
![Mathematical equation: $$ \begin{aligned} F(t)= {\left\{ \begin{array}{ll} A \exp [(t-t_{\rm p})/\tau _{\rm r}],&t < t_{\rm p}, \\ (A-F_d)\exp [-(t-t_{\rm p})/\tau _{\rm d}] + F_d,&t \ge t_{\rm p}, \end{array}\right.} \end{aligned} $$](/articles/aa/full_html/2026/08/aa60291-26/aa60291-26-eq4.gif) (C.1)
(C.1)
where A, Fd, tp, τr, and τd denote the peak flux, the late-time constant flux level, the time of the flux peak relative to the initial EP/WXT detection, and the rise and decay timescales, respectively. The best-fit parameters are A = (4.75 ± 0.08)×10−10 erg cm−2 s−1, Fd = (0.68 ± 0.02)×10−10 erg cm−2 s−1, tp = 2.6 ± 0.2 days,  days, and
  days.
days.
We note that the EP/WXT flux measurements appear systematically offset from those obtained with other telescopes during the decay phase, likely due to the narrower energy band of EP/WXT.
C.2. Binary system parameters
Assuming a 10 M⊙ BH accretor and adopting a viscosity parameter of ν = 1015 cm2 s−1 (Powell et al. 2007), the outer disk radius can be estimated from the exponential decay timescale as
 (C.2)
(C.2)
Assuming that this radius is comparable to the circularization radius Rcirc and a binary mass ratio of q = 0.1, the orbital period can be estimated using Eq. 4.18 of Frank et al. (1992):
![Mathematical equation: $$ \begin{aligned} \begin{aligned} P_{\rm orb} =&\, \frac{2\pi R_\odot ^{3/2}}{\sqrt{G M_\odot }} \left( \frac{M_1}{M_\odot } \right)^{-1/2} \\&\times \left( \frac{R_{\rm circ}}{R_\odot } \right)^{3/2} (1+q)^{-2} \left[ 0.500 - 0.227 \log _{10} q \right]^{-6} . \end{aligned} \end{aligned} $$](/articles/aa/full_html/2026/08/aa60291-26/aa60291-26-eq8.gif) (C.3)
(C.3)
This gives an estimated orbital period of Porb ≈ 4.3 hr. However, due to observational gaps caused by Sun-avoidance constraints, we cannot exclude the possibility that the source experienced a reflare between 2025 October and 2026 March, which could introduce uncertainties into the system parameter estimations.
Appendix D: Supplementary figures and tables
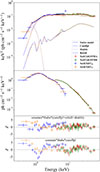 |
Fig. D.1. Joint spectral fitting of the Swift/XRT (2025 September 23 and 26) and NuSTAR (2025 September 24) observations. Top: Unfolded spectrum in units of keV2 (ph cm−2 s−1 keV−1) with the best-fit model tbabs*(cutoffpl+relxill+diskbb). Second: Unfolded spectrum in units of ph cm−2 s−1 keV−1. Third and bottom: Residuals for tbabs*(cutoffpl+relxill+diskbb) and tbabs*cutoffpl, respectively. The spectra are re-binned for display purposes. |
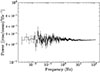 |
Fig. D.2. Averaged power density spectrum of the NuSTAR observation on 2025 September 24 in the 4–78 keV energy band. |
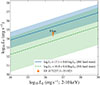 |
Fig. D.3. Optical/X-ray luminosity relation for LMXBs. The blue line and shaded region show the empirical correlation and its 1σ uncertainty for hard-state BH XRBs, while the green line and shaded region show those for hard-state NS XRBs (Russell et al. 2006). The star symbol marks EP J175257.3–351923 at an assumed distance of 8 kpc, with a de-reddened V-band luminosity near the outburst peak of ≲4 × 1034 erg s−1 and a quasi-simultaneous 2–10 keV X-ray luminosity of ∼3 × 1036 erg s−1. |
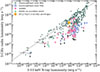 |
Fig. D.4. Radio versus X-ray luminosities of LMXBs in the hard state (adapted from Bahramian & Rushton 2022), with EP J175257.3–351923 overlaid. The radio constraint is a 3σ VLASS upper limit at 3 GHz (2026 February 1), converted to 5 GHz assuming a flat radio spectrum. The X-ray luminosity is from the EP/FXT observation on 2026 April 22. Although the X-ray and radio observations are not simultaneous, the source had entered a plateau phase, and the X-ray luminosity is therefore assumed to be comparable at the VLASS epoch. Both luminosities assume a distance of 8 kpc. |
X-ray follow-up observations.
Best-fitting spectral parameters of the joint Swift/XRT and NuSTAR spectra.
All Tables
All Figures
|
Fig. 1. Multiwavelength images of EP J175257.3–351923. (a) EP/WXT discovery image of the new transient. (b) EP/FXT-B follow-up image. The blue cross and yellow plus mark the EP/FXT and Swift/XRT positions, respectively. (c) Swift/UVOT V-band image. The white circle shows the Swift/XRT positional uncertainty (2.2″, 90%), red crosses mark three cataloged sources detected in both Gaia and VIRAC2/VVVX, and cyan stars indicate two additional sources listed only in VIRAC2/VVVX. (d) SVOM/VT B-band image, with the same symbols as in panel (c). All images have been smoothed for display purposes. |
| In the text | |
|
Fig. 2. Long-term X-ray evolution: unabsorbed 2–10 keV flux/luminosity, hydrogen column density (NH), power-law index (Γ), inner disk temperature (Tin), and inner disk radius (Rin). Open symbols indicate fixed diskbb values. Different symbols correspond to different instruments. The solid red line represents the best-fitting FRED model (excluding the pre-outburst EP/WXT upper limit). Luminosity and Rin are calculated assuming D = 8 kpc, M = 10 M⊙, and i = 58° (Table D.2). |
| In the text | |
|
Fig. 3. HID during the outburst. EP/WXT data are excluded due to the narrow energy band. The inset shows a zoomed-in view. Faint gray points show long-term MAXI data of GX 339–4 (“q”-like tracks of “successful” outbursts are evident) for comparison. |
| In the text | |
|
Fig. A.1. GROND observations on 2025 September 17. The images have been smoothed for display purposes. Symbols follow the same convention as in Fig. 1. |
| In the text | |
|
Fig. D.1. Joint spectral fitting of the Swift/XRT (2025 September 23 and 26) and NuSTAR (2025 September 24) observations. Top: Unfolded spectrum in units of keV2 (ph cm−2 s−1 keV−1) with the best-fit model tbabs*(cutoffpl+relxill+diskbb). Second: Unfolded spectrum in units of ph cm−2 s−1 keV−1. Third and bottom: Residuals for tbabs*(cutoffpl+relxill+diskbb) and tbabs*cutoffpl, respectively. The spectra are re-binned for display purposes. |
| In the text | |
|
Fig. D.2. Averaged power density spectrum of the NuSTAR observation on 2025 September 24 in the 4–78 keV energy band. |
| In the text | |
|
Fig. D.3. Optical/X-ray luminosity relation for LMXBs. The blue line and shaded region show the empirical correlation and its 1σ uncertainty for hard-state BH XRBs, while the green line and shaded region show those for hard-state NS XRBs (Russell et al. 2006). The star symbol marks EP J175257.3–351923 at an assumed distance of 8 kpc, with a de-reddened V-band luminosity near the outburst peak of ≲4 × 1034 erg s−1 and a quasi-simultaneous 2–10 keV X-ray luminosity of ∼3 × 1036 erg s−1. |
| In the text | |
|
Fig. D.4. Radio versus X-ray luminosities of LMXBs in the hard state (adapted from Bahramian & Rushton 2022), with EP J175257.3–351923 overlaid. The radio constraint is a 3σ VLASS upper limit at 3 GHz (2026 February 1), converted to 5 GHz assuming a flat radio spectrum. The X-ray luminosity is from the EP/FXT observation on 2026 April 22. Although the X-ray and radio observations are not simultaneous, the source had entered a plateau phase, and the X-ray luminosity is therefore assumed to be comparable at the VLASS epoch. Both luminosities assume a distance of 8 kpc. |
| In the text | |
Current usage metrics show cumulative count of Article Views (full-text article views including HTML views, PDF and ePub downloads, according to the available data) and Abstracts Views on Vision4Press platform.
Data correspond to usage on the plateform after 2015. The current usage metrics is available 48-96 hours after online publication and is updated daily on week days.
Initial download of the metrics may take a while.