


Fig. 1.
Download original image
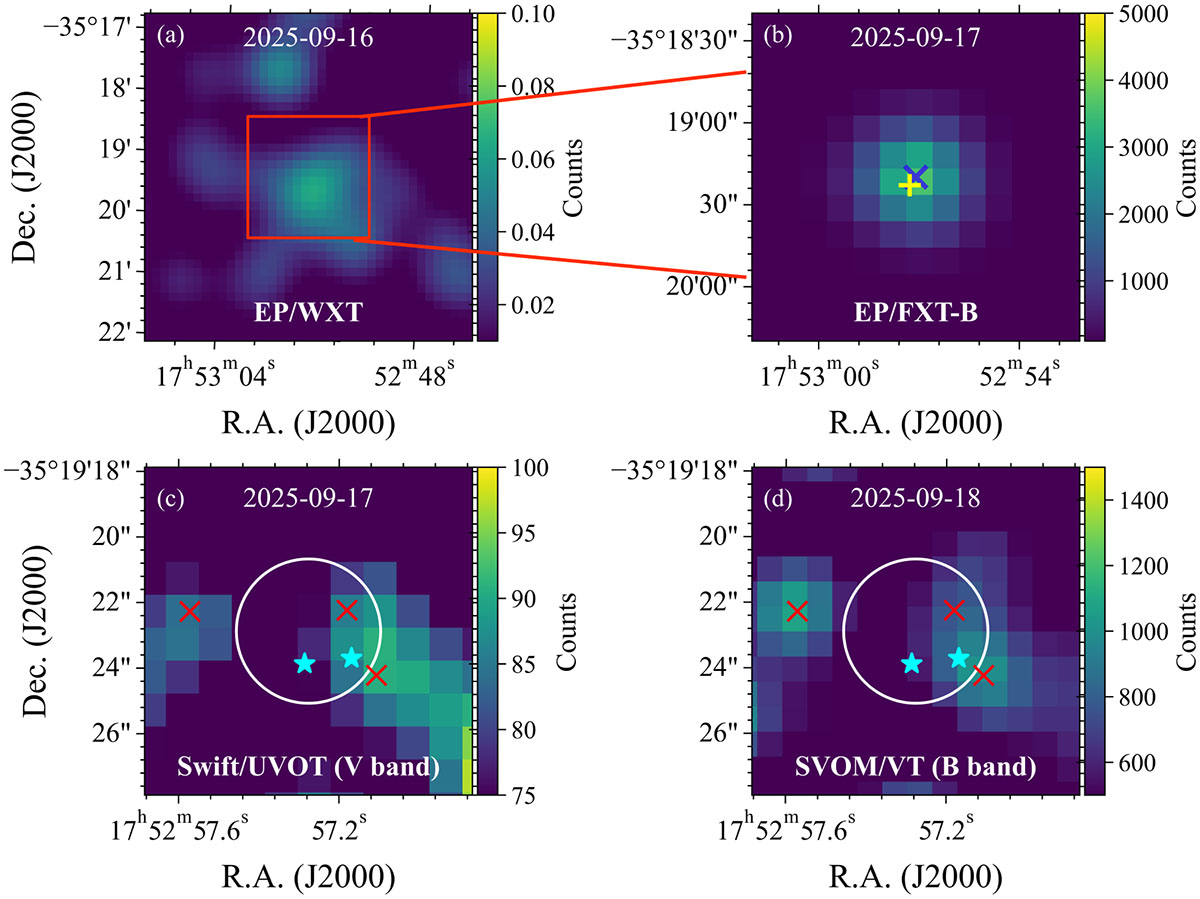
Multiwavelength images of EP J175257.3–351923. (a) EP/WXT discovery image of the new transient. (b) EP/FXT-B follow-up image. The blue cross and yellow plus mark the EP/FXT and Swift/XRT positions, respectively. (c) Swift/UVOT V-band image. The white circle shows the Swift/XRT positional uncertainty (2.2″, 90%), red crosses mark three cataloged sources detected in both Gaia and VIRAC2/VVVX, and cyan stars indicate two additional sources listed only in VIRAC2/VVVX. (d) SVOM/VT B-band image, with the same symbols as in panel (c). All images have been smoothed for display purposes.
Current usage metrics show cumulative count of Article Views (full-text article views including HTML views, PDF and ePub downloads, according to the available data) and Abstracts Views on Vision4Press platform.
Data correspond to usage on the plateform after 2015. The current usage metrics is available 48-96 hours after online publication and is updated daily on week days.
Initial download of the metrics may take a while.