


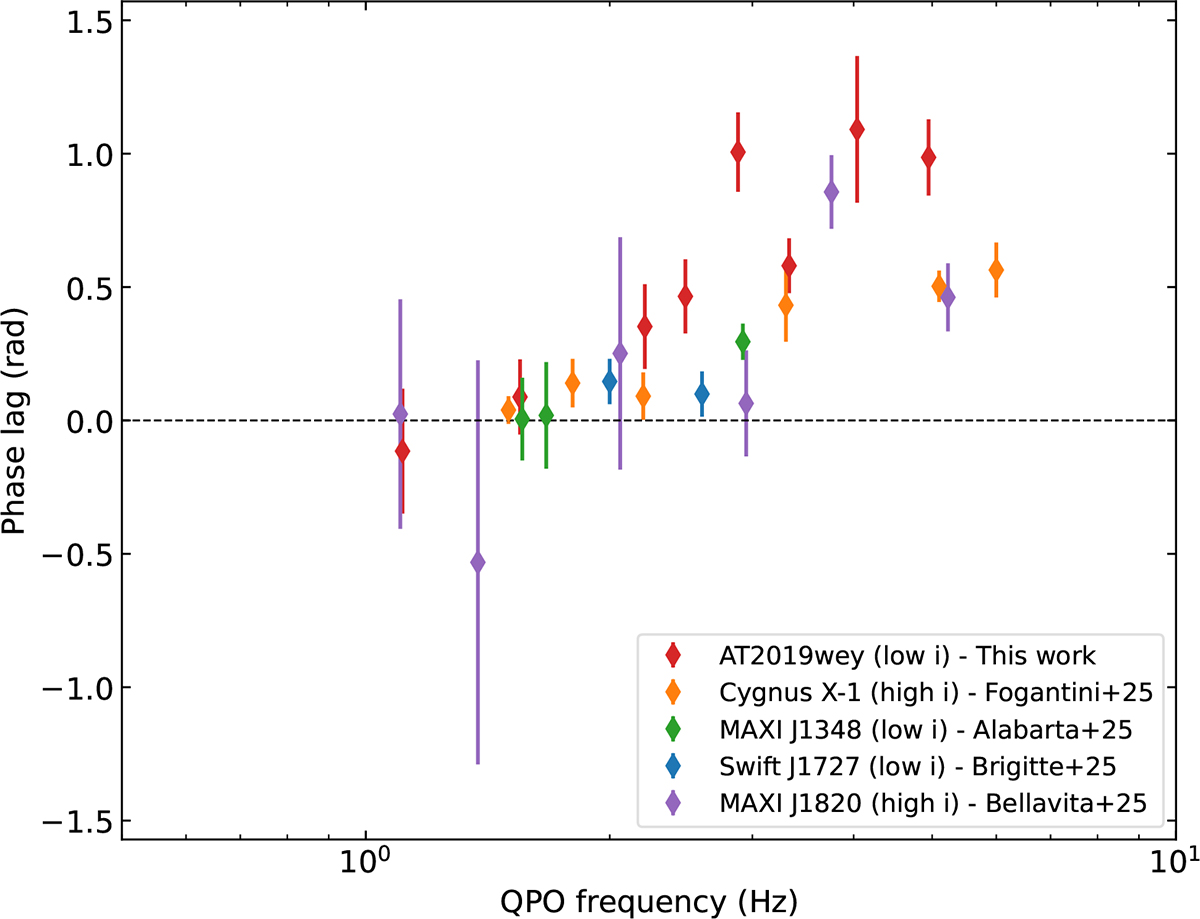
Fig. 6.
Download original image
Phase lag of the imaginary QPO as a function of QPO frequency. The inclination (high or low) of each source is inferred from X-ray reflection fitting. The phase lags are computed between the 2 − 5 keV (reference band) and 5 − 12 keV (subject band) energy bands. For AT2019wey, MAXI J1348–630, MAXI J1820+070, and Cygnus X–1, we use NICER data, while for Swift J1727.8–1613 we use XMM-Newton data.
Current usage metrics show cumulative count of Article Views (full-text article views including HTML views, PDF and ePub downloads, according to the available data) and Abstracts Views on Vision4Press platform.
Data correspond to usage on the plateform after 2015. The current usage metrics is available 48-96 hours after online publication and is updated daily on week days.
Initial download of the metrics may take a while.